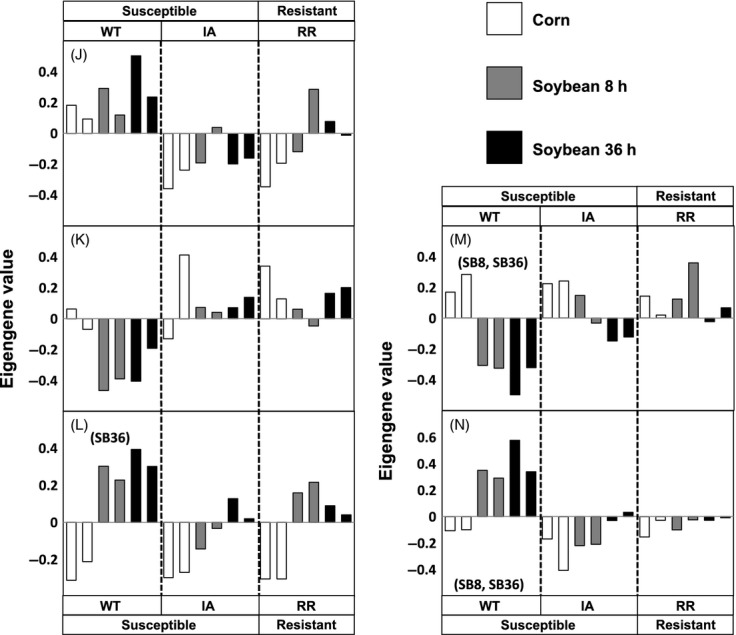
Figure 3.

Expression patterns of modules whose expression is similar between rotation-resistant (RR) WCR and WCR from Ames, Iowa (yet different from other WT-WCR), under at least one dietary condition. These data are shaded by the dietary treatments, while the phenotypic groups are indicated above/below the figures. The bar heights represent eigengene values of the Illumina sequencing samples. Modules J and K did not have a significant ‘phenotype × diet’ interaction in a two-way anova test. The remaining modules had significant interactions and were subjected to simple main effect tests; the diets in which the eigengene values exhibit the pattern of interest are labeled next to (or below) their module IDs. CR, corn; SB8, eight hours on soybean; SB36, thirty-six hours on soybean.
