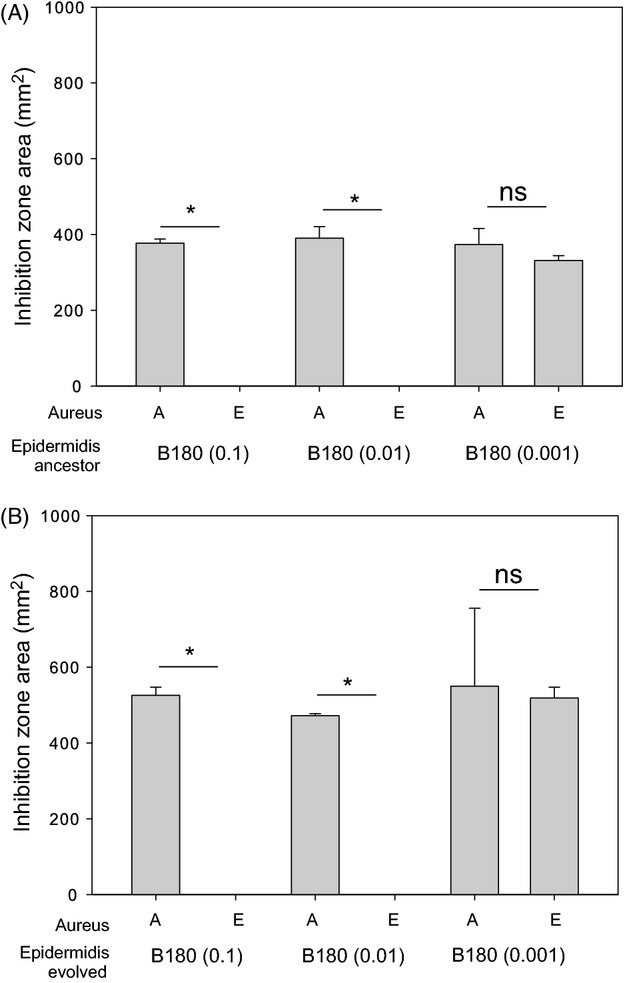
Figure 3.

Resistance of evolved SH1000 resident after Staphylococcus epidermidis (B180) invasion. Panel A shows inhibition zone produced by the ancestral S. epidermidis strains, and panel B shows the inhibition zones produced by the evolved S. epidermidis strains. Both panels A and B show the inhibition zone area (mm2) produced by the toxin-producing S. epidermidis strains against the ancestral SH1000 (A) and the evolved SH1000 (E). Asterisks represent a significant difference between the inhibition zone areas of ancestral (A) and evolved (E) S. aureus strains as determined by a Fisher’s exact test. Each significance star represents a P value of 0.0022 which is significant when Bonferroni corrected for multiple comparisons with an alpha value of 0.1. Error bars represent the standard error of the mean.
