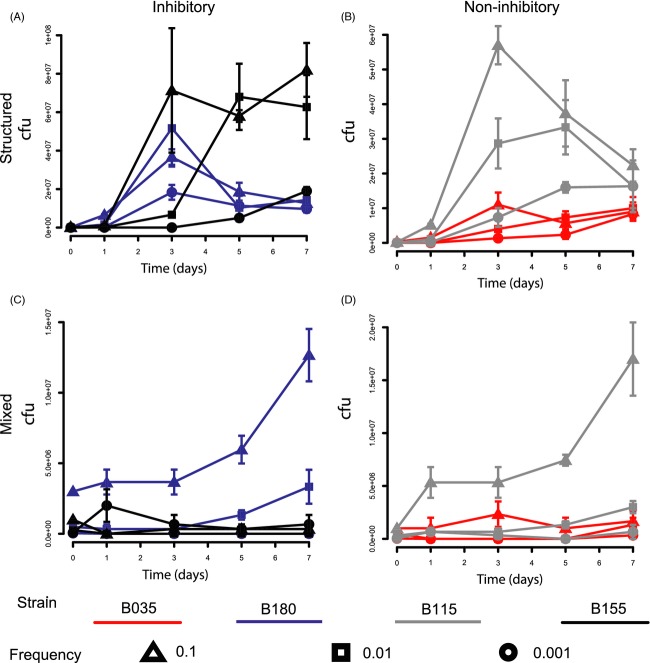
Figure 7.
Toxin-producing ( and
and  ) and nonproducing (
 and
and  ) isolates of Staphylococcus epidermidis invading populations of S. aureus (SH1000) at frequencies of 0.1 (
 ), 0.01 (
 ) and 0.001 (
 ). Toxin-producing S. epidermidis isolates (155 and 180) and nonproducing S. epidermidis isolates (035 and 115) were introduced into a population of S. aureus (SH1000) at three different frequencies. This was carried under a spatially structured regime (A and B) and under a mixed regimen (C and D). The x-axis is the time in days, and the y-axis is the colony-forming units (cfu) per plate. Error bars represent the standard error of the mean (n = 3).

