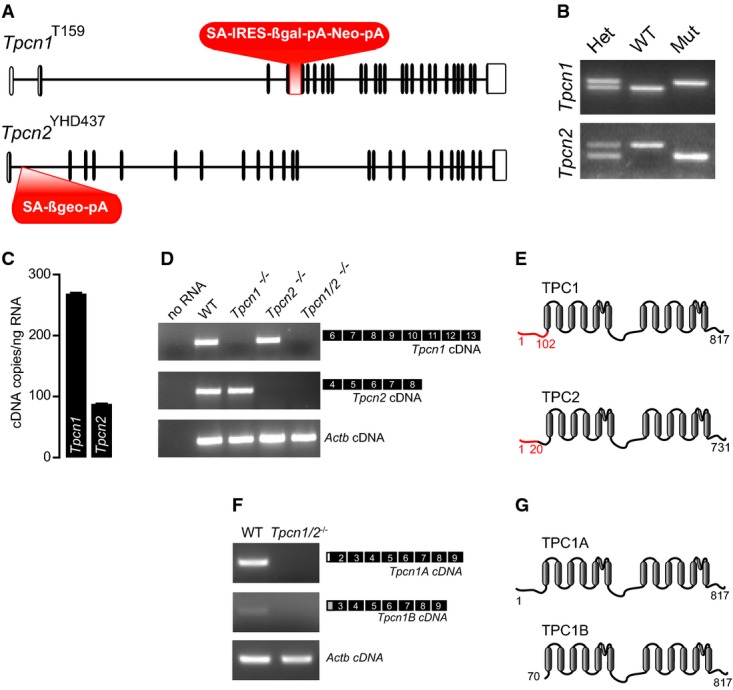
Gene structure of Tpcn1T159 and Tpcn2YHD437 alleles in transgenic mice. Exons are represented as vertical segments (UTRs, unfilled boxes); knockout and gene trap cassettes are represented in red. Splice acceptor (SA), internal ribosomal entry site (IRES), β-galactosidase gene (βgal), neomycin resistance gene (Neo), β-galactosidase/neomycin resistance chimeric gene (βgeo), polyadenylation signal (pA).
Genotyping results for homozygote wild-type (WT), homozygote mutant Tpcn1T159 or Tpcn2YHD437 (Mut), and heterozygote animals (Het).
RT–qPCR analysis of absolute levels of Tpcn1 and Tpcn2 transcripts in WT MEFs. Tpcn1/Tpcn2 ratio of expression corresponds to 3.0; n = 6; mean ± SEM.
RT–PCR analysis of Tpcn1 and Tpcn2 expression in MEFs from WT or homozygote transgenic embryos. Amplified cDNAs correspond to exons shown in black. Expression of Actb was used as a control.
Two-domain organization of TPC1 and TPC2 proteins showing transmembrane helices (grey) and amino acid residues (numbers). Predicted residual expression of TPC proteins from transgenic animals is represented in red.
RT–PCR analysis of Tpcn1A and Tpcn1B expression in MEFs from WT or Tpcn1/2−/− embryos. Amplified cDNAs correspond to the exons shown in black including isoform-specific 5′-UTRs (white box for Tpcn1A and grey box for Tpcn1B). Expression of Actb was used as a control.
TPC1 protein variants expressed from Tpcn1A and Tpcn1B transcripts.
Source data are available online for this figure.

