
Figure 2.
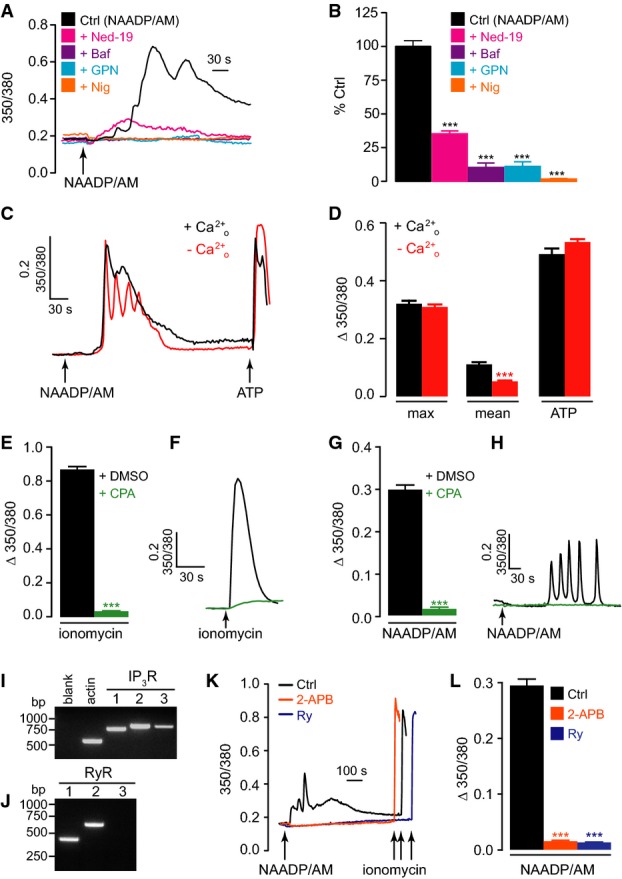
NAADP induces Ca2+ release from acidic Ca2+ stores
- A, B Representative single-cell Ca2+ traces showing 350/380 ratios of fura-2 fluorescence (A) and maximum Ca2+ changes (B) upon addition of 10 μM extracellular NAADP/AM in WT MEFs, which were blocked by pre-incubation with 10 μM trans-Ned-19 (Ned-19; 45 min), 1 μM bafilomycin A1 (Baf; 45 min), 5 μM nigericin (Nig; 30 min), or 200 μM GPN (5 min); control (Ctrl) was pre-incubated with DMSO (vehicle); n = 121–272; ***P < 0.001 relative to control using the ANOVA-Tukey test.
- C, D Ca2+ signals with 10 μM NAADP/AM in 1.8 mM extracellular Ca2+ (+ Ca2+o) or Ca2+-free medium containing 100 μM EGTA (− Ca2+o) in WT MEFs. (C) Representative single-cell fura-2 Ca2+ traces upon addition of 10 μM NAADP/AM and 100 μM ATP. (D) Maximum Ca2+ changes (max) and mean Ca2+ release over a period of 300 s post-addition of 10 μM NAADP/AM;n = 233–385 cells; ***P < 0.001 relative to + Ca2+o using an unpaired t-test.
- E–H Cells treated with 200 μM CPA or 0.1% DMSO in medium + Ca2+o for 50 min. Cells were then briefly washed and maintained in Ca2+-free medium (+100 µM EGTA) in which they were stimulated with 2 μM ionomycin (E, F) or 10 μM NAADP/AM (G, H). Maximum Ca2+ changes (E, G) and representative single-cell fura-2 Ca2+ traces (F, H); n = 49–148 cells; ***P < 0.001 relative to DMSO control, using the unpaired t-test.
- I, J MEFs express all three IP3 receptor subtypes (IP3R 1–3) and ryanodine receptor (RyR) types 1 and 2, detected by RT–PCR analysis. Blank refers to no RNA. Positive control for expression for RyR type 3 is shown in Supplementary Fig S1.
- K, L Cells treated with 2 μM 2-APB, 20 μM ryanodine, or 0.1% DMSO prior to application of 10 μM NAADP/AM. Representative single-cell fura-2 Ca2+ traces (K) and maximum Ca2+ changes (L); n = 142–374; ***P < 0.001 relative to control using the unpaired t-test.