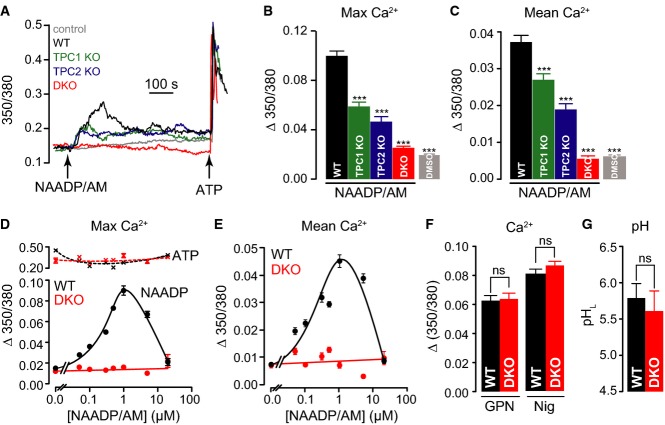
Figure 3.
- A–C Representative single-cell fura-2 Ca2+ traces (A), maximum Ca2+ changes (B), and mean Ca2+ release over a period of 500 s (C), post-addition of 10 μM NAADP/AM to wild-type (WT), Tpcn1−/− (TPC1 KO), Tpcn2−/− (TPC2 KO), and Tpcn1/2−/− (DKO) MEFs. Control corresponds to WT cells treated with DMSO;n = 384–621; ***P < 0.001 relative to WT using the ANOVA–Tukey test.
- D, E Maximum amplitude (D) and mean Ca2+ (E) of the responses to different NAADP/AM concentrations in WT and DKO cells. The subsequent maximum response to 100 μM ATP (cf. (A)) after each NAADP/AM concentration is also plotted (D). 1 μM NAADP/AM induced a maximal Ca2+ peak corresponding to 39 ± 3% of the 100 μM ATP response; n = 41–105.
- F Maximum Ca2+ responses to 200 μM GPN or 10 μM nigericin; n = 111–285; P > 0.05 (ns) relative to WT using the ANOVA–Tukey test.
- G Endo-lysosomal luminal pH (pHL) by endocytosed fluorescently labelled dextrans in primary MEFs determined by single-cell measurements; n = 105 for WT or DKO.

