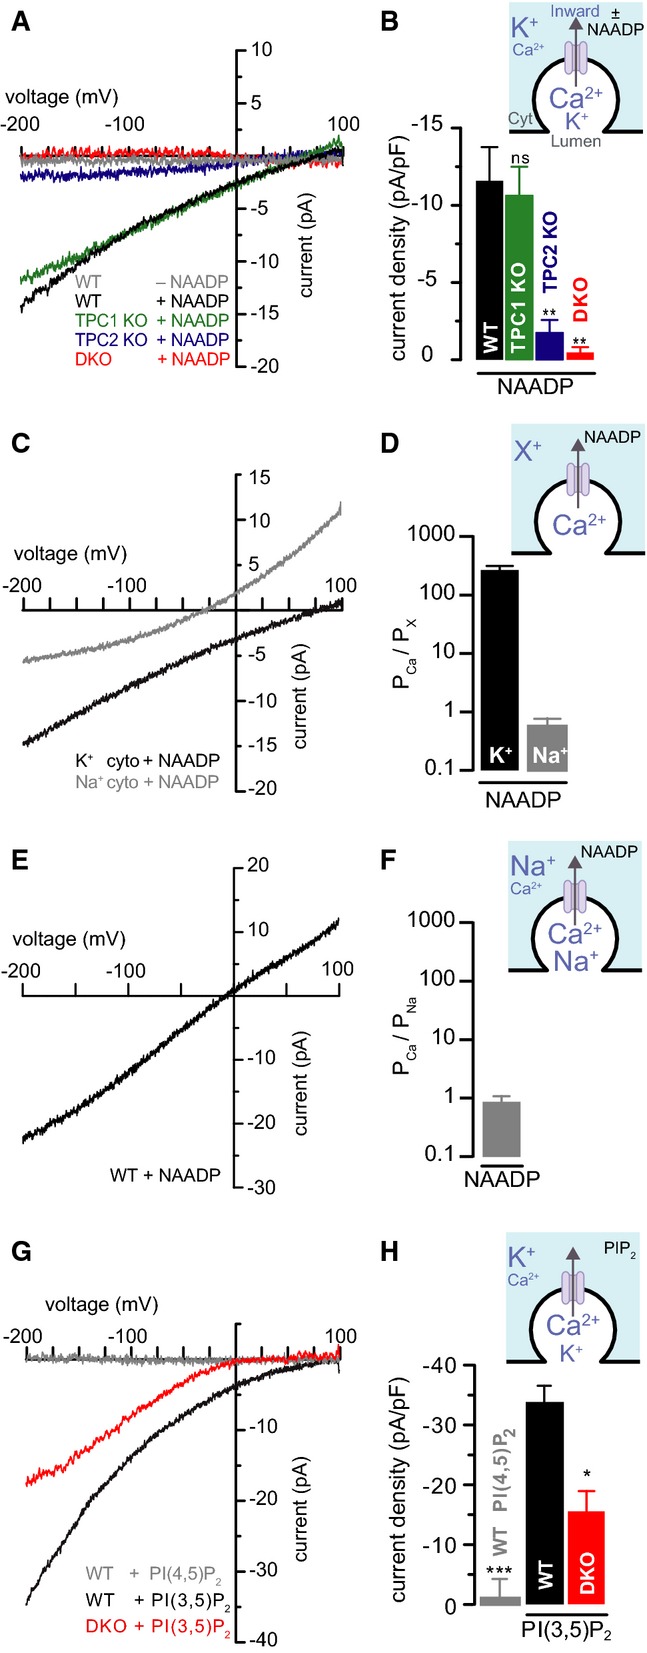
Figure 4.

- A, B Single-lysosome currents from wild-type (WT), Tpcn1−/− (TPC1 KO), Tpcn2−/− (TPC2 KO), and Tpcn1/2−/− (DKO) MEFs in the presence or absence of cytosolic NAADP (50 nM); solutions contained Ca2+ (cytosol: 0.2 mM; lumen: 60 mM) plus K+ (cytosol: 130 mM; lumen: 70 mM). Inward currents are defined as lumen-to-cytosol. (A) Representative current–voltage (I–V) curves from single isolated lysosomes. (B) Population data were measured at −200 mV from (A); n = 5–6; ns, P > 0.05, **P < 0.01 relative to WT using the ANOVA-Tukey test.
- C, D NAADP (50 nM)-evoked single-lysosome currents from WT MEFs under bi-ionic conditions: 160 mM monovalent “X+” (either K+ or Na+) in the cytosol and 107 mM Ca2+ in the lumen. (C) Representative I–V curves from isolated lysosomes. (D) Population data of the relative Ca2+/monovalent permeability ratios; n = 9–11.
- E, F Single-lysosome currents from WT MEFs in the presence of cytosolic NAADP (50 nM); solutions contained Ca2+ (cytosol: 0.2 mM; lumen: 61 mM) and Na+ (cytosol: 160 mM; lumen: 70 mM). (E) Representative I–V curve from single lysosomes derived from WT MEFs. (F) Population data of the relative Ca2+/Na+ permeability ratios; n = 6.
- G, H Single-lysosome currents from WT or DKO MEFs in the presence of cytosolic PI(3,5)P2 (10 μM) or PI(4,5)P2 (10 μM); solutions contained Ca2+ (cytosol: 0.2 mM; lumen: 60 mM) plus K+ (cytosol: 130 mM; lumen: 70 mM). (G) Representative I–V curves from single lysosomes derived from WT or DKO MEFs. (H) Population data were measured at −200 mV from (G); n = 3–4; ***P < 0.001, *P < 0.05 relative to WT/PI(3,5)P2 using Student's t-test.
