
Figure 4.
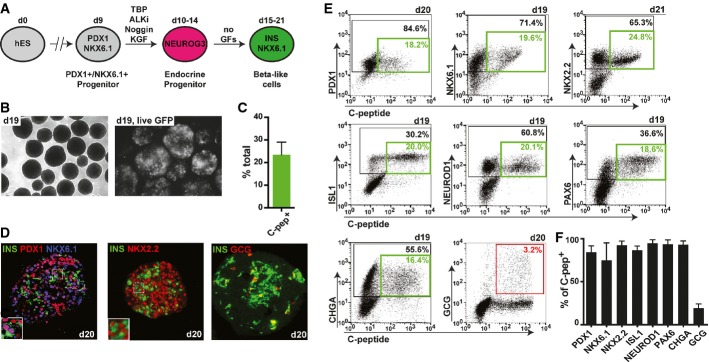
Efficient generation of PDX1+/NKX6.1+ pancreatic progenitor cells prior to endocrine induction results in beta-like cells
- Schematic outlining a simplified differentiation strategy for the controlled, stepwise generation of pancreatic progenitor and subsequent endocrine cell types. GFs, growth factors.
- Micrographs of differentiated clusters at day 19 under light microscopy (left picture) or fluorescent microscopy showing prominent GFP expression (right picture; GFP expression shown in white).
- Quantification of the percentage of human C-peptide-positive cells at day 19–21. Values are average ± SD. n = 7 independent experiments.
- Immunofluorescence stainings of differentiated clusters at day 20 for insulin (INS), PDX1, NKX6.1, NKX2.2, and glucagon (GCG). One of four experiments with similar outcome is shown.
- Representative flow cytometry plots depicting co-expression of pancreatic markers PDX1, NKX6.1, NKX2.2, ISL1, NEUROD1, PAX6, chromogranin A (CHGA), and GCG with human C-peptide at indicated time points. Black gates mark percentage of total cells positive for indicated marker on y-axis. Green gates mark percentage of double-positive beta-like cells. The red gate marks percentage of INS+/GCG+ bihormonal cells.
- Flow cytometric quantification of C-peptide-positive beta-like cells co-expressing markers in (E). A high percentage of beta-like cells co-express all genes usually found in beta cells, but not the hormone GCG. Values are average ± SD. n = 4 for PDX1, n = 19 for NKX6.1, n = 4 for NKX2.2, n = 9 for ISL1, n = 9 for NEUROD1, n = 5 for PAX6, n = 6 for CHGA, and n = 5 for GCG. Analysis was performed at days 15–21 of differentiation.