TUT7 distinguishes pre-miRNA substrates at binding step
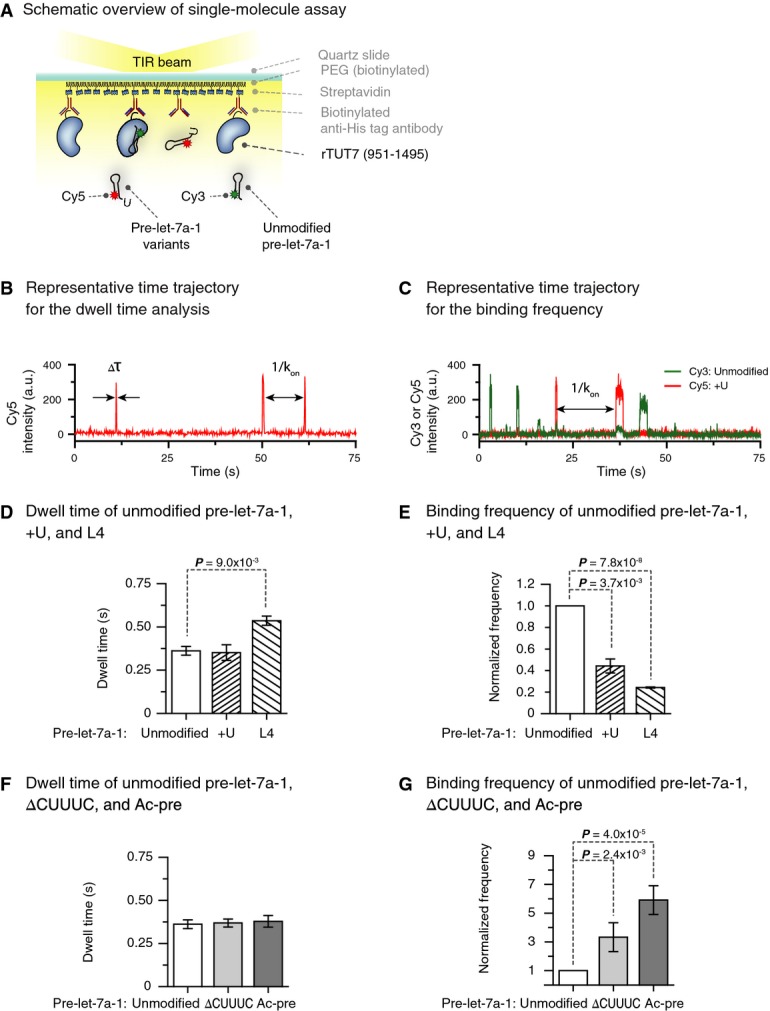
Schematic overview of the single-molecule assay. Recombinant TUT7 951–1,495 (rTUT7) fused to a 6×-His was immobilized on a PEGylated surface using anti-His tag antibodies. Afterward, fluorescently labeled RNA substrates were introduced into the chamber.
Representative time trajectory for the dwell time analysis. Δτ, dwell time of interaction; kon, binding rate.
Representative time trajectory for binding frequency measurements. kon, binding rate.
Average dwell time of pre-let-7a-1 +U and L4 mutants (n = 3). Pre-let-7a-1 +U showed similar dwell time to unmodified pre-let-7a-1. Pre-let-7a-1 L4 yielded slightly increased dwell time (P-value 9.0 × 10⁻³, two-tailed t-test). Error bars represent standard error.
Binding frequency of pre-let-7 +U and L4 mutants relative to unmodified pre-let-7a-1 (n = 3). Pre-let-7a-1 +U and L4 mutants showed much lower binding frequency compared to unmodified pre-let-7a-1 (P-values 3.7 × 10⁻³ and 7.8 × 10⁻⁸, respectively, two-tailed t-test). Error bars represent standard error.
Average dwell time of pre-let-7a-1 ΔCUUUC and Ac-pre mutants (n = 3). Pre-let-7a-1 ΔCUUUC and Ac-pre had similar dwell times compared to unmodified pre-let-7a-1. Error bars represent standard error.
Binding frequency of pre-let-7 ΔCUUUC and Ac-pre mutants relative to unmodified pre-let-7a-1 (n = 3). Pre-let-7a-1 ΔCUUUC and Ac-pre mutants displayed much higher binding frequency compared to unmodified pre-let-7a-1 (P-values 2.4 × 10⁻³ and 4.0 × 10⁻⁵, respectively, two-tailed t-test). Error bars represent standard error.
Data information: All data sets (D–G) are normally distributed (Shapiro–Wilk test,
P > 0.1). All the datasets of the binding frequency measurements showed equality in variance (
F-test). For the dwell time measurements, some data sets did not show equality in variance (+U and -CUUUC) in
F-test, and we have adjusted our two-tailed
t-tests accordingly.

