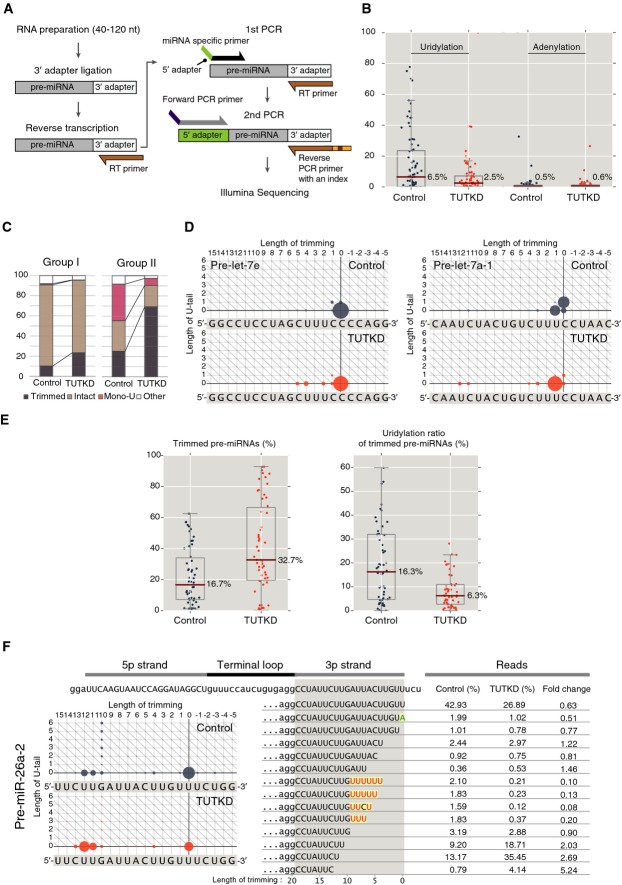
Figure 4.
- Scheme of pre-miRNA deep sequencing.
- Box plot of uridylation ratio and adenylation ratio of 78 pre-miRNAs, which are sequenced in both control sample and TUT7/4/2 knockdown cells. Dark red line indicates the median. TUT7/4/2 knockdown suppressed uridylation specifically.
- Mono-uridylation of group I (let-7a-2, let-7c, and let-7e) and group II (let-7a-1, let-7a-3, let-7b, let-7d, let-7f-1, let-7f-2, let-7g, let-7i, and miR-98) pre-let-7s in control and TUT7/4/2 knockdown (TUTKD) HeLa cells. A considerable portion of intact group II pre-let-7s was mono-uridylated (“Mono-U”) in control. Upon TUT7/4/2 knockdown, mono-uridylation of intact group II pre-let-7s substantially decreased. The reads whose length of trimming is > 0 were defined as “Trimmed”. The reads whose length of trimming is = 0 with none non-templated addition were defined as “Intact”. The reads whose length of trimming is = 0 with one non-templated uridine were defined as “Mono-U”. The rest reads were defined as “Other”. The percentage was calculated by normalizing with total read.
- Dot plots of pre-let-7e (group I) and pre-let-7a-1 (group II). The status of 3′ trimming and 3′ U-tailing for each pre-miRNA read is represented by a circle on a two-dimensional matrix. The x-axis represents the length of 3′ trimming, and the y-axis represents the length of U-tail. Area of a circle is proportional to the relative abundance of the pre-miRNA reads. Reference sequence of the hairpin is shown below the dot plot. Position 0 indicates the 3′ end of genomic sequence of most abundant read in control HeLa cells. Pre-let-7e was rarely mono-uridylated in control and was not affected by TUT7/4/2 knockdown. In contrast, about half of pre-let-7a-1 was mono-uridylated in control, and the mono-uridylated reads almost disappeared upon TUT7/4/2 knockdown. The style of the figure was adopted from Zhao et al (2012).
- Box plot of trimmed ratio and uridylation ratio of trimmed species of 54 pre-miRNAs, which have more than 400 reads. Dark red line indicates the median. Uridylation of trimmed pre-miRNAs decreased, while trimmed pre-miRNA reads increased upon TUT7/4/2 knockdown (TUTKD).
- Dot plots and representative reads of pre-miR-26a-2. Representative reads are union of top 10 abundant reads in control or TUT7/4/2 knockdown (TUTKD) sample. Red letter, non-templated uridine; green letter, non-templated adenine; yellow box, non-templated tailing. Proportion (%) of each pre-miRNA species is indicated in each sample, and fold change was calculated by dividing the proportion of TUTKD (%) by the proportion of Control (%). Trimmed pre-miR-26a-2 reads were substantially uridylated. In TUT7/4/2 knockdown cells, trimmed pre-miRNA reads increased.

