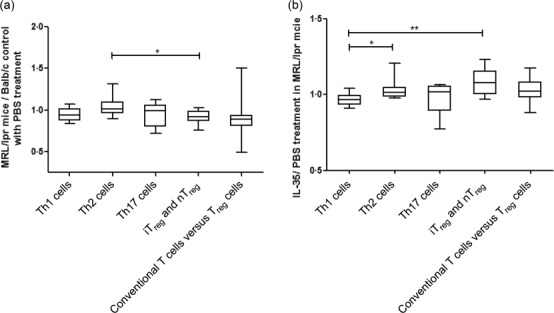
Figure 3.

RT2 profiler polymerase chain reaction (PCR) array of mouse T helper (Th) cell differentiation. The results of epigenetically regulated gene expressions of Th1 cells, Th2 cells, inducible regulatory T cells (iTreg) and natural (n)Treg, Th17 cells and conventional T cells versus Treg cells in (a) phosphate-buffered saline (PBS)-treated Murphy Roths Large (MRL)/lpr versus BALB/c mice (in ratio) and (b) interleukin (IL)-35 treated versus PBS-treated MRL/lpr mice (as ratio) are grouped according to the instruction of the classification of kit and presented as box-and-whisker plots with the median [interquartile range (IQR)]. Mann–Whitney U-test was used to assess the differences of mRNA expression among different epigenetically regulated genes of Th cells. *P < 0·05, **P < 0·01.
