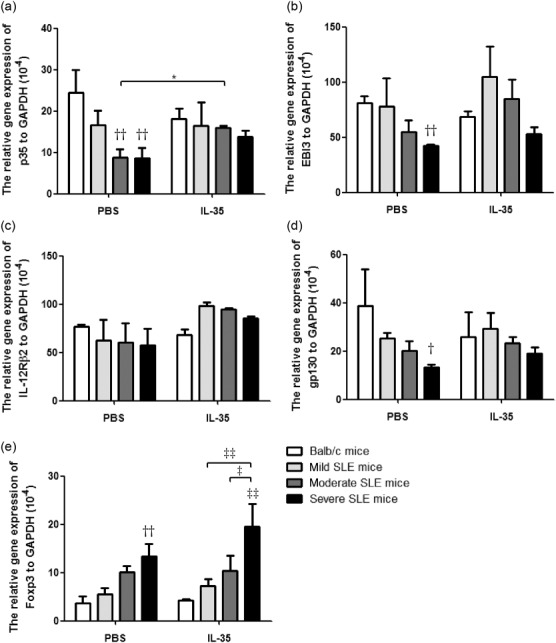
Figure 4.

The differences of mRNA expression of p35, EBI3, gp130, IL-12Rβ2 and forkhead box protein 3 (FoxP3) of splenic cells between interleukin (IL)-35 and phosphate-buffered saline (PBS) treatment. Total RNA extracted from splenic cells from Murphy Roths Large (MRL)/lpr and BALB/c mice was reverse-transcribed and analysed by quantitative polymerase chain reaction (qPCR). Results were presented as Bar charts showing the arithmetic mean plus standard error of the mean (s.e.m.). *P < 0·05, PBS versus IL-35 treatment; ††P < 0·01, BALB/c control mice versus PBS-treated MRL/lpr mice; ‡P < 0·05, ‡‡P < 0·01, ‡‡‡P < 0·001, BALB/c control mice versus IL-35-treated MRL/lpr mice (n = 5 in each group).
