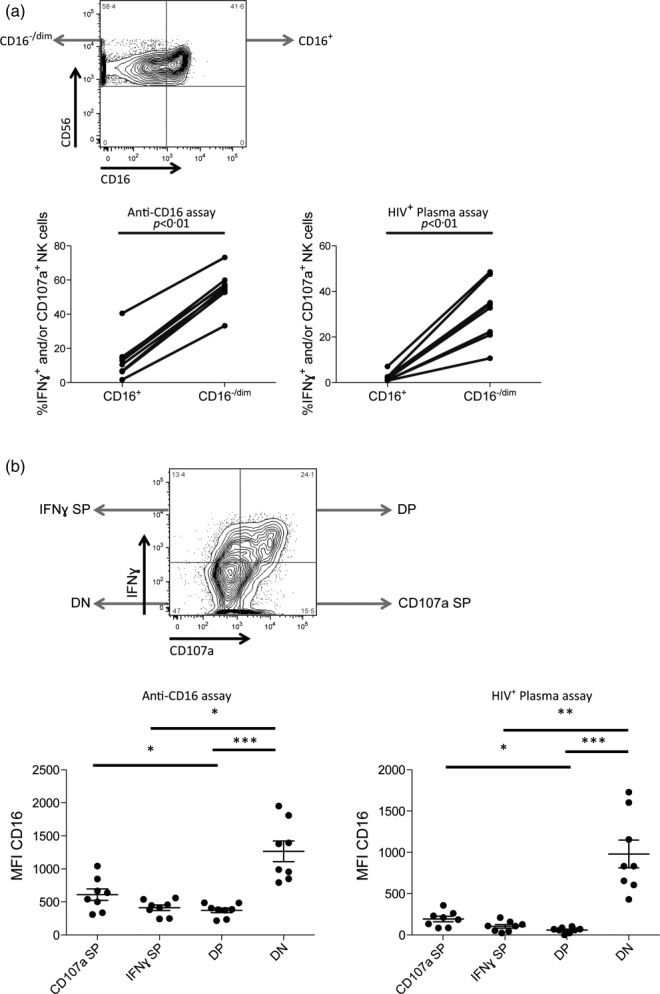
Figure 2.

Functional profile of natural killer (NK) cells exhibiting reduced cell surface CD16 expression. (a) The fluorescence activated cell sorter (FACS) plot illustrates gating to identify CD16dim/− and CD16+ NK cells (top). Graphs (bottom) illustrate the relative activation [i.e. interferon (IFN)-γ production and/or CD107a expression] of the CD16dim/− and CD16+ NK cell populations after activation in the HIV+ plasma (right) and anti-CD16 (left) NK cell activation assays. (b) The FACS plot illustrates the gating utilized to identify the IFN-γ+ CD107a+ [i.e., double positive (DP)], IFN-γ+ CD107a− [i.e., IFNγ single positive (SP)], IFN-γ− CD107a+ [i.e., CD107a SP] and IFN-γ− CD107a− [i.e., double negative (DN)] functional profiles. Graphs depict the relative CD16 median fluorescence intensity (MFI) on NK cells exhibiting the IFN-γ+ CD107a+ [i.e., DP], IFN-γ+ CD107a− [i.e., IFNγ SP], IFN-γ− CD107a+ [i.e., CD107a SP] and IFN-γ− CD107a− [i.e., DN] functional profiles after stimulation in the HIV+ plasma (right) and anti-CD16 (left) NK cell activation assays. Lines above graphs represent statistically significant post-hoc comparisons. *P < 0·05; **P < 0·01; ***P < 0·001.
