
Figure 3.
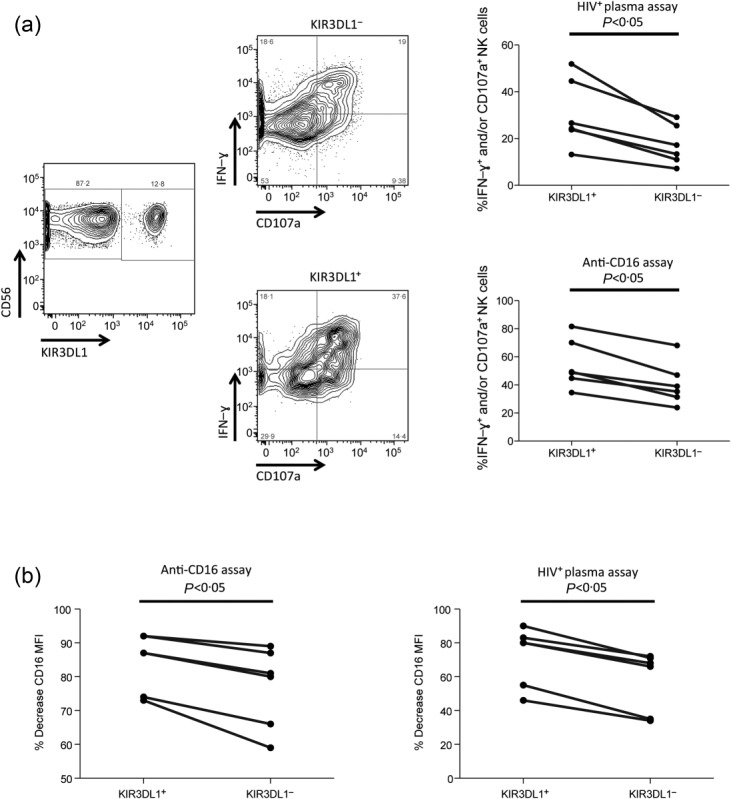
Influence of natural killer (NK) cell education on NK cell antibody-dependent function and post-activation CD16 cleavage. (a) Fluorescence activated cell sorter (FACS) plots depict the gating utilized to identify KIR3DL1+ and KIR3DL1− NK cells, as well as the ability of these NK cell subsets to produce interferon (IFN)-γ+ and express CD107a. Graphs portray the relative activation (i.e. IFN-γ+ and/or CD107a+) of KIR3DL1+ and KIR3DL1− NK cells after activation in the HIV+ plasma (top) and anti-CD16 (bottom) NK cell activation assays. (b) Graphs depict the percentage decrease in CD16 median fluorescence intensity (MFI) on KIR3DL1+ and KIR3DL1− NK cell populations after activation in the anti-CD16 (left) and HIV+ plasma (right) NK cell activation assays.