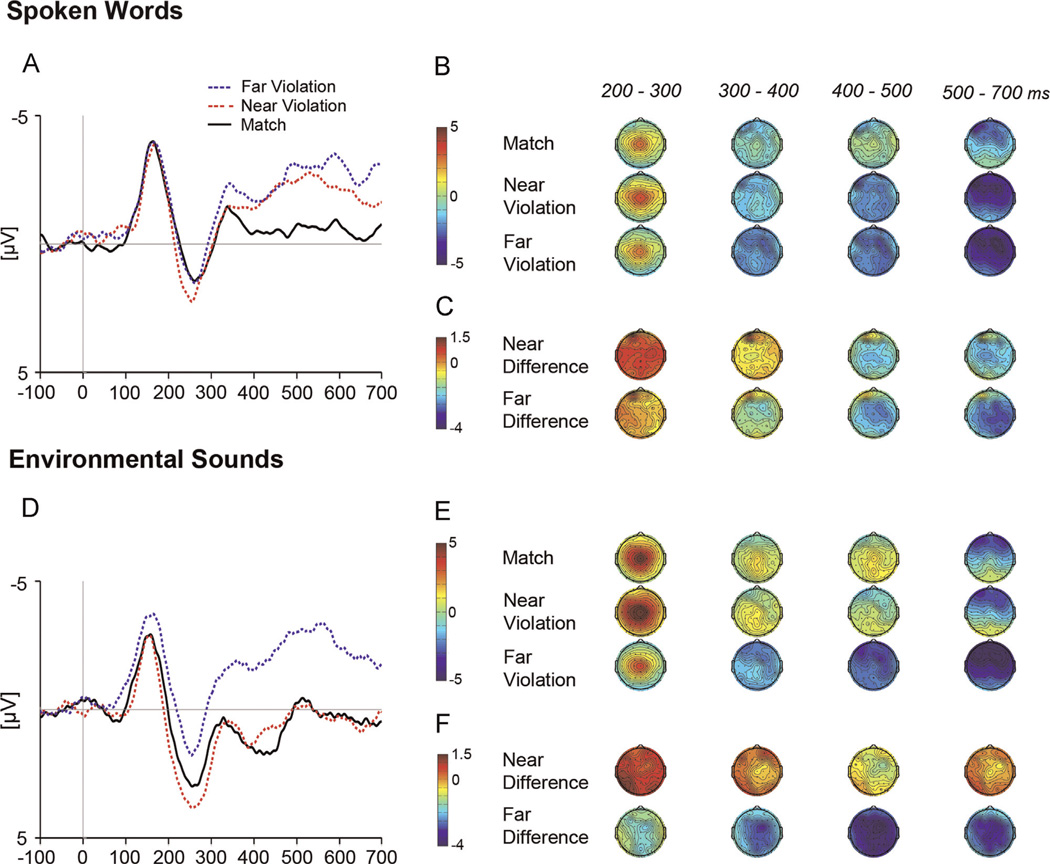
Fig. 3.
ERP waveforms and voltage maps. Effect of featural similarity shown at the central-posterior region for Words (A) and Environmental Sounds (C). Voltage maps show average voltage for Words (B) and Environmental Sounds (E), and average voltage difference (measured as Violations – Matches) for Words (C) and Environmental Sounds (F) between two fixed latencies.

