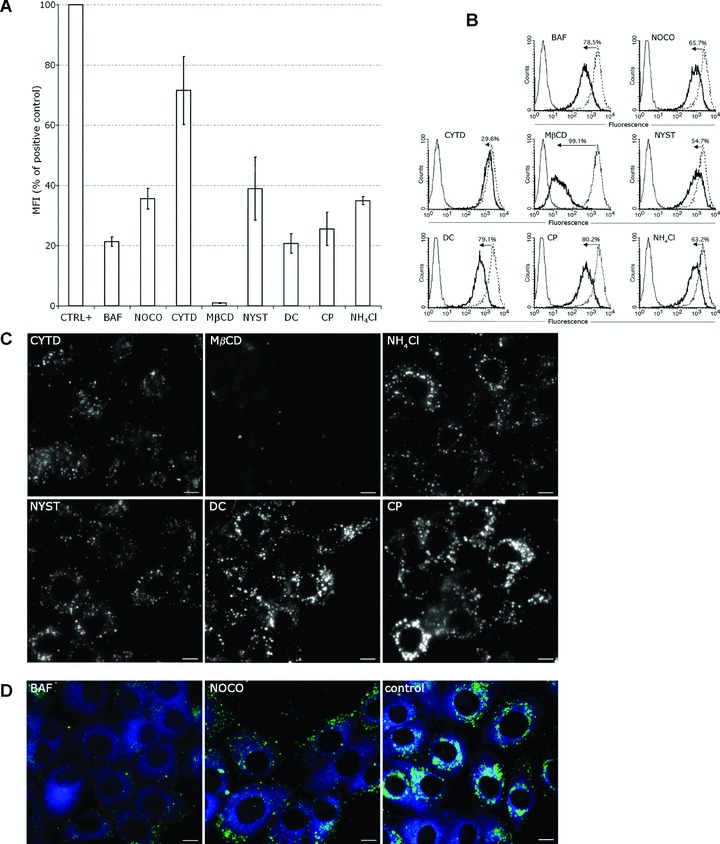
Figure 2.

Effects of inhibitors on the liposomes uptake and traffic. (A and B) Flow cytometry for the analysis of liposome uptake in the presence or absence of inhibitors (black line and dotted line histograms, respectively). Cells were treated or not with inhibitors and liposomes-containing calcein were added as in ‘Materials and methods’. Grey line histograms represent negative control cells. (A) Median fluorescence intensity of calcein in positive control cells = 100%. Error bars indicate standard deviation (n= 3 independent experiments). (B) The numbers in the histogram plots were calculated from the median fluorescence and indicate the percentage of uptake inhibition induced by drugs. Median fluorescence of positive control cells was set to 100%. (C) After 1 hr pre-treatment with inhibitors MDBK cells were incubated with liposome-included calcein for 30 min. at 37°C in the presence of drugs. Liposomes were removed and cells were further incubated in the presence of drugs for either 2 hrs (CYTD), or 5 hrs (the other inhibitors). (D) As in (C), but 30 min. before visualization cells were incubated with the ER marker, ER-tracker (blue). Scale bar 10 μm.
