
Figure 3.
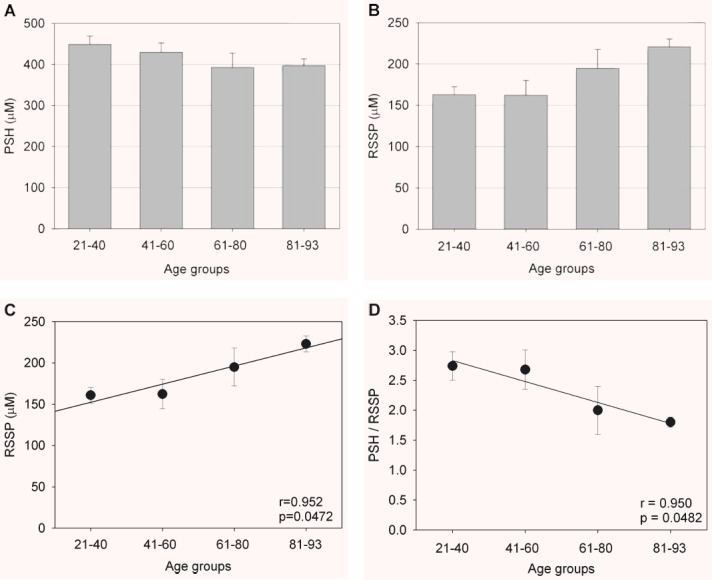
Plasma levels of reduced protein sulphydryl groups (PSH) (A) and S-thiolated proteins (RSSP) (B, C) for each age group. (D): Shows the age-dependent decrease in the plasma reduced protein thiols/S-thiolated proteins (PSH/RSSP) ratio for each age group. Data are means ± S.D. Statistical significance (one-way ANOVA, P < 0.05): (A): 21–40 versus 61–80 and versus 81–93; 41–60 versus 81–93; (B): 21–40 and 41–60 versus 81–93. (C): 21–40 versus 61–80 and 81–93; 41–60 versus 61–80 and 81–93.