
Figure 4.
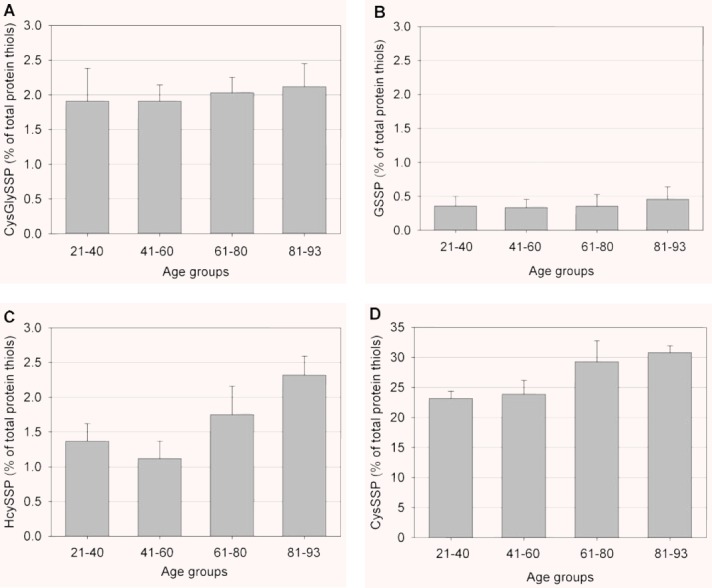
Plasma levels of S-cysteinylglycinylated (CysGlySSP) (A), S-glutathionylated (GSSP) (B), S-homocysteinylated (HcySSP) (C), and S-cysteinylated (CysSSP) and (D) proteins for each age group. All values are expressed as the percentage to total plasma protein thiols. Data are means ± S.D. Statistical significance (one-way ANOVA, P < 0.05): (C): 21–40 versus 81–93; 41–60 versus 61–80 and 81–93; 61–80 versus 81–93; (D): 21–40 versus 61–80 and 81–93; 41–60 versus 61–80 and 81–93.