
Figure 4.
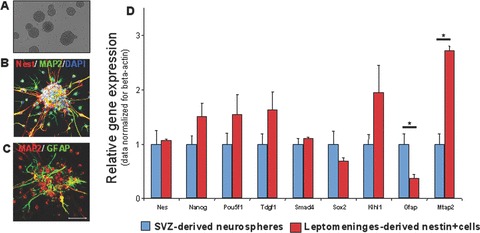
In vitro expansion of the tissue extract in neural stem cell growth conditions. Floating neurospheres were obtained, with morphology and phenotype comparable to those of SVZ-NSC-derived neurospheres. (A) Transmitted light of leptomeningeal-derived neurosphere. Confocal image of neurospheres stained with MAP2 (green), nestin (red) and DAPI (blue) (B), or MAP2 (red) and GFAP (green) (C), scale bar 100 μm. (D) Relative gene expression analysis. For each sample, expression levels of different genes were normalized to levels of beta-actin mRNA. The bars show fold change ± S.D. in transcription of normalized mRNA expression levels measured for leptomeninges-derived neurosphere compared to SVZ-NSC-derived neurosphere.