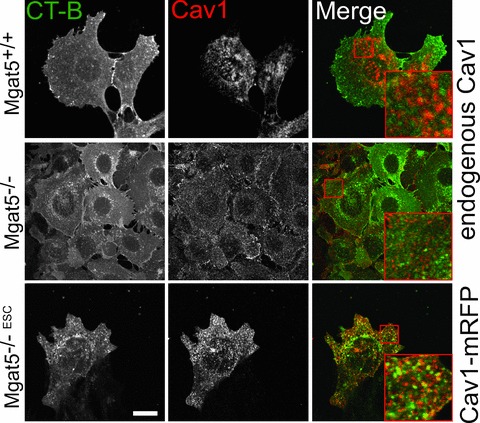
Figure 5.

Minimal co-localization of cell surface CT-b and Cav1. Mgat5+/+ and Mgat5−/– cells were incubated with CT-b-FITC (green) for 30 min. at 37°C, fixed and labelled for Cav1 (red). Alternatively, Mgat5−/–ESC cells transfected with Cav1-mRFP (red) were incubated with CT-b-FITC (green) for 30 min. at 37°C (bottom row). Regions boxed in red are enlarged to reveal the incidence of co-localization. Bar = 20 μm.
