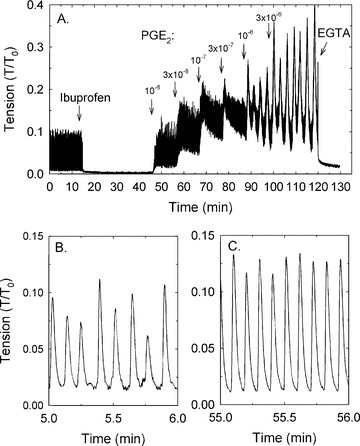
Figure 4.

Example (of n= 4 observation) of the protocol used to measure the contractile effect of exogenously added prostaglandins (PGE-2 shown) after inhibition of SRC using 10 μM ibuprofen (A). EGTA was added at the end of the experiment to measure the minimum tension. Examples of SRC (B) and PGE-2-induced rhythmic contraction (C) shown in a time-expanded scale reveals the similar nature of the responses. Note that the x-axis time scales in the time-expanded regions (B and C) refer to the time regions of plot A from which the data were extracted.
