
Figure 3.
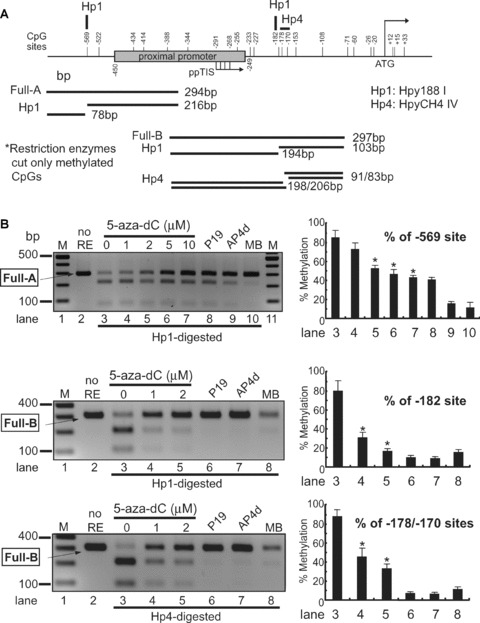
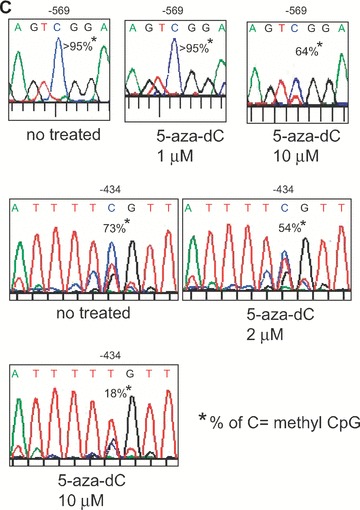
Analysis of DNA methylation by methylation-sensitive restriction enzyme assay. (A) – The proximal MOR promoter, its flanking regions, and the positions of the CpG sites are shown. Methylation-specific PCR products (Full-A) were amplified using MS-647 and MAS-353 primers (Table 1) after sodium bisulphite treatment for genomic DNA. The restriction enzyme Hpy188I (Hp1) recognizes and cuts amplified PCR products that contain the retained C residue at the –569 position. For the –182 and –178/–170 sites, MS-376 and MAS-79 primers were used for the PCR amplification (Full-B) and digested with either Hp1 or HpyCH4IV (Hp4), respectively. The predicted sizes of the methylation-specific PCR products and the digested fragments are shown below. (B) – PCR products (Full-A and Full-B fragments) from NS20Y cells treated with the indicated concentrations of 5-aza-dC, as well as from undifferentiated P19 cells, fully differentiated P19 cells (AP4d), and mouse brain (MB). Intact PCR product (no RE) was used as a control. The graphs to the right of each gel show the percentage of methylation, determined by comparing the intensity of the bands cut by Hp1 or Hp4 relative to the intensity of the unmethylated (i.e. upper, uncut bands). Column numbers in graph indicate the corresponding gel lanes. Data for the graphs are the mean ± S.E.M. from three independent experiments. *Indicates P < 0.05 compared with no 5-aza-dC-treated samples. (C) – Methylation analyses of MOR promoter by automated authentic DNA sequencing. Methylation percentages on two CpG sites (–569 and –434) from the Full-A methylation-specific PCR product were reduced by 5-aza-dC treatment.