
Figure 4.
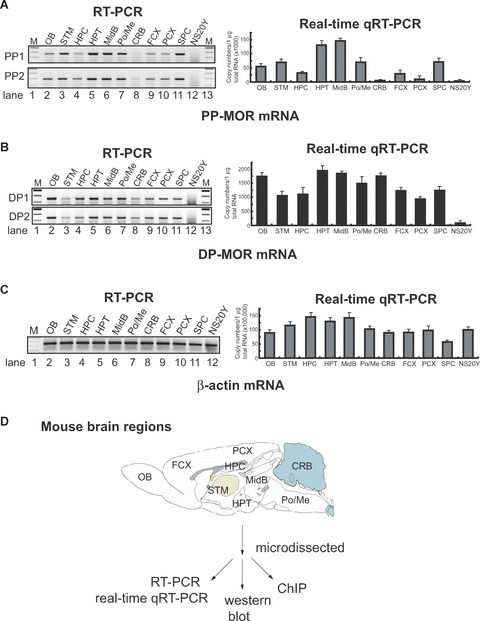
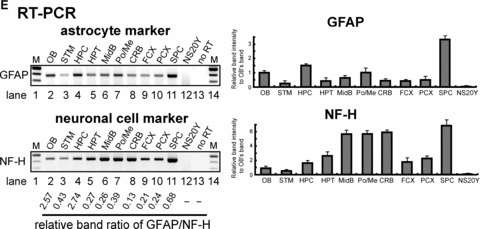
Differential expression of the PP- and distal promoter (DP)-transcripts in regions microdissected from mouse brain. (A) and (B). Mouse brains were dissected into different regions (as shown in Fig. 4D) for the epigenetic study of MOR gene expression: olfactory bulb (OB), striatum (STM), hippocampus (HPC), hypothalamus (HPT), midbrain (MidB), Pons/Medulla (Po/Me), cerebellum (CRB), frontal cortex (FCX), posterior cortex (PCX), spinal cord (SPC). NS20Y cells were used as the MOR-negative control. To reduce PCR errors, two PCR primer sets (PP1 and PP2 for PP-MOR, DP1 and DP2 for DP-MOR; see Table 1) amplifying from different locations for each transcript were used for RT-PCR. For real-time qRT-PCR, only one set of PCR primers was used for each transcript (MOR_E3-S and MOR_E4-AS for PP-MOR, S-408 and AS-285 for DP-MOR). (C) – Results of RT-PCR and real-time qRT-PCR using β-actin primers (Table 1). (D)– Diagram of mouse brain regions (sagittal view) included in this study. Dissected regions from two to three brains were pooled for the indicated experiments. At least three different dissections were performed separately to repeat the RT-PCR and real-time qRT-PCR experiments. Data shown for real-time qRT-PCR are mean ± S.E.M. from the three independent experiments. (E)– Expression of neuronal cell marker [27] neurofilament H (NF-H) and astrocyte marker glial fibrillary acidic protein (GFAP) genes in microdissected brain regions analysed by RT-PCR. Primers for NF-H and GFAP [25] were used for RT-PCR. NS20Y cells and samples with no added RT enzyme were used as negative controls. The intensities of the bands are expressed graphically (right), and the ratio of GFAP to NF-H expression is indicated under the gels.