
Figure 5.
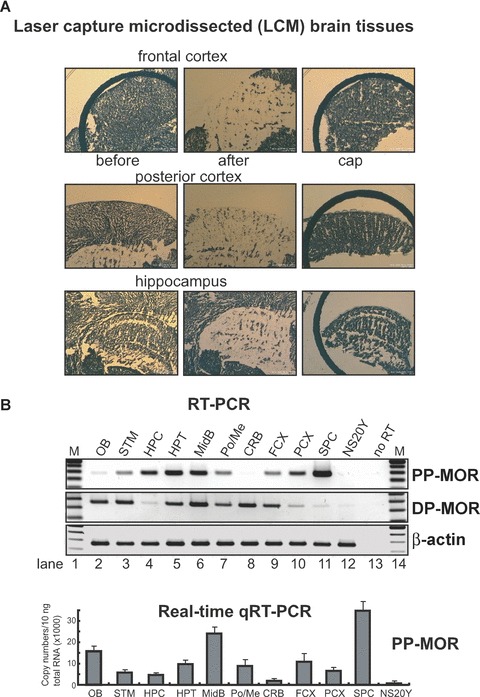
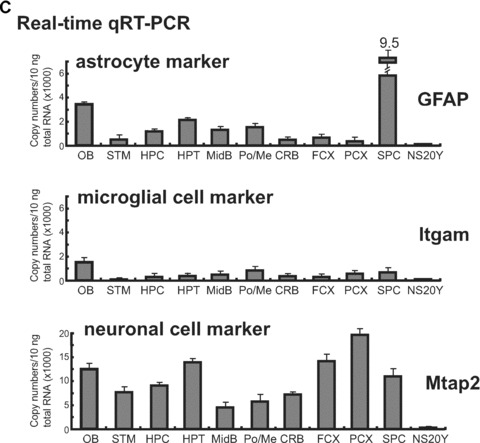
Differential expression of the MOR gene in laser capture microdissection (LCM) brain samples. (A)– Dissected regions (frontal cortex, posterior cortex, and hippocampus) from mouse brain tissue sections are shown before and after sampling, along with captured samples (Cap). (B)– Expression patterns of PP-MOR in specific microdissected brain regions, as determined by RT-PCR using the primers MOR-S1 and MOR-AS1. The results of the real-time qRT-PCR from LCM brain and spinal cord samples are shown graphically below the RT-PCR data. NS20Y cells were included as a control. (C)– Expression of cell type-specific marker genes in brain regions prepared by LCM were analysed by real-time qRT-PCR using PCR primers (Table 1) for glial fibrillary acidic protein (astrocytes), integrin-α M (Itgam; microglia), and microtubule-associated protein 2 (Mtap2; neuronal cells). NS20Y cells were used as a negative control. The results are expressed as described above for the MOR gene.