
Figure 3.
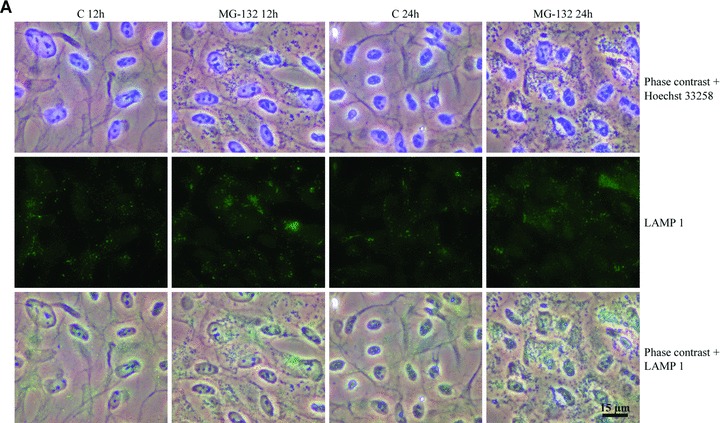

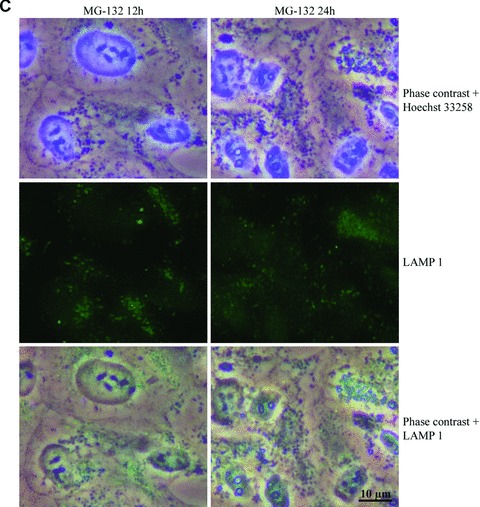
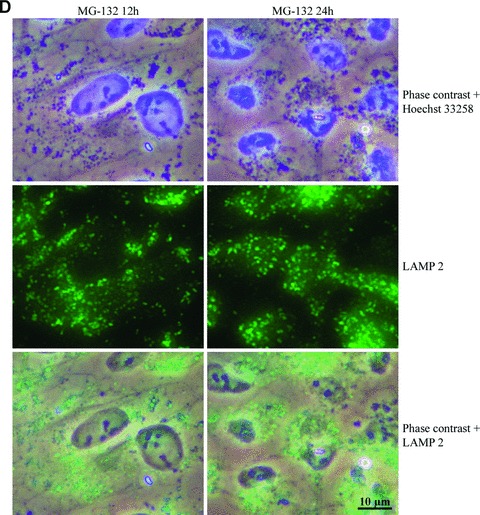
Phase contrast microscopy and immunofluorescence analysis of (A) LAMP-1 and (B) LAMP-2 in control cells (C 12h, C 24h), and cells exposed to 10 μM MG-132 for 24 hrs. Nuclei were stained with Hoechst 33258 dye (blue). (C) and (D) represent higher magnification of the LAMP-1 and LAMP-2 stainings related to (A) and (B) images, respectively. Scale bars 15 μm and 10 μm.