
Figure 1.
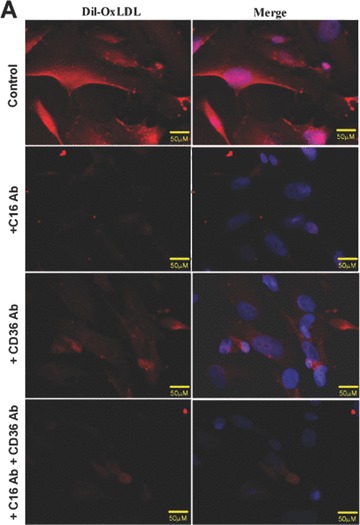
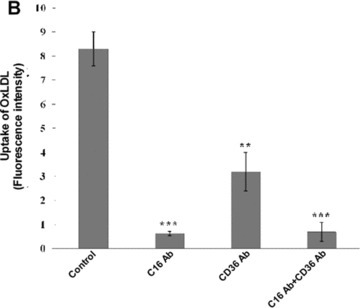
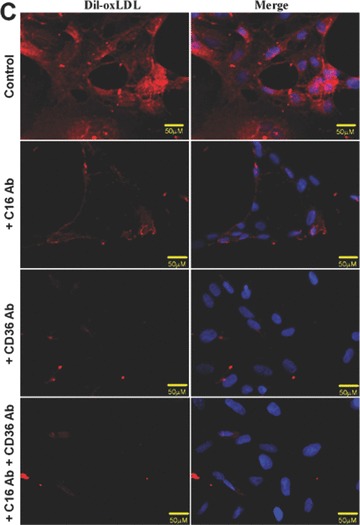
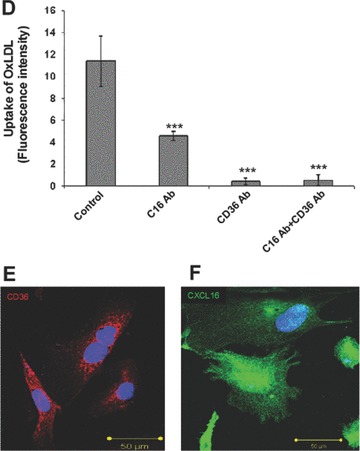
Involvement of CXCL16 and CD36 in the uptake of oxLDL. (A) DiI-oxLDL uptake was analysed after the pre-treatment of podocytes with an IgG control antibody (control), a CXCL16 blocking antibody (+C16 Ab), a CD36 blocking antibody (+CD36 Ab), or both antibodies (+C16 Ab + CD36 Ab). After pre-incubation of human podocytes with the blocking antibodies, cells were incubated for 4 hrs with 100 μg/ml DiI-oxLDL (red) and subsequently washed with PBS and fixed in methanol/0.02% EDTA. In addition, cells were stained with DAPI to visualize the nuclei (blue). (B) Semi-quantitative analysis of the fluorescence intensity of DiI-oxLDL in cells pre-treated with a control IgG antibody (control), a CXCL16 antibody (C16 Ab), a CD36 antibody (CD36Ab) or with a combination of both antibodies (C16AB+CD36Ab). Mean fluorescence of DiI-oxLDL was measured with an image software from Keyence. (C) DiI-oxLDL uptake was analysed after pre-incubation of the primary tubular cell line HRCEpiC with an IgG control antibody (control), a CXCL16 blocking antibody (+C16Ab), a CD36 blocking antibody (+CD36Ab) or the combination of both blocking antibodies (+C16Ab+CD36Ab) and visualized by immunofluorescence microscopy. After pre-incubation of HRCEpiC with the different blocking antibodies, cells were incubated for 4 hrs with 100 μg/ml DiI-oxLDL (red) and subsequently washed with PBS and fixed in methanol/0.02% EDTA. The cells were stained with DAPI to visualize the nuclei (blue). (D) Fluorescence intensity of DiI-oxLDL in HRCEpiC pre-treated with an IgG control antibody (control), a CXCL16 antibody (C16 Ab), a CD36 antibody (CD36Ab) or the combination of both antibodies (C16Ab+CD36Ab) was determined with the BZ-Analyzer software (Keyence). Data represent mean ± S.D. ***P < 0.001; **P < 0.01 considered statistically significant compared to the control. (E) Podocytes were fixed with 4% paraformaldehyde and CD36 expression was investigated using monoclonal CD36 and Cy3 coupled secondary antibodies (red). The cells were stained with DAPI to detect the nuclei (blue) of the cells. Fluorescence analyses were performed with a LSM 510 Meta confocal laser-scanning microscope (Carl Zeiss, Jena, Germany). (F) Podocytes were fixed with methanol and incubated with CXCL16 antibodies followed by Alexa 488 coupled secondary antibodies (green). Cells were than incubated with DAPI to visualize nuclei (blue). Fluorescence analyses were performed with a LSM 510 Meta confocal laser-scanning microscope (Carl Zeiss).