
Figure 6.
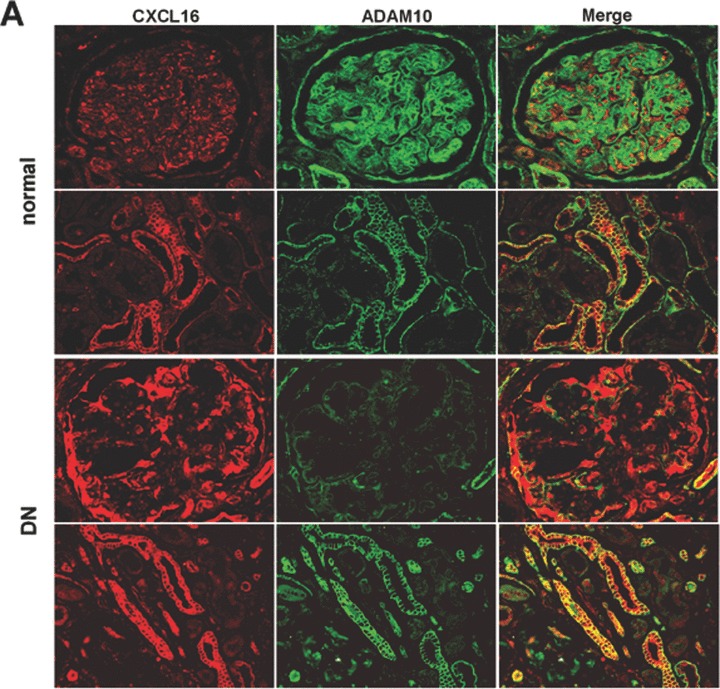
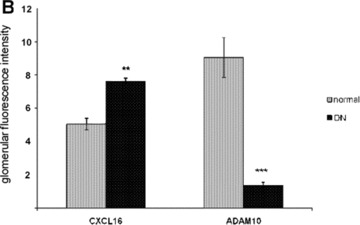
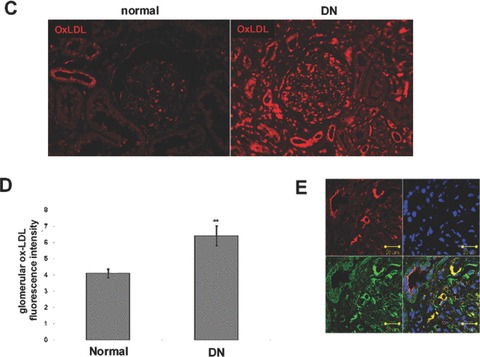
Expression of CXCL16 and ADAM10 in tissue section of normal kidney and patients with DN. (A) Renal tissue of normal kidney (normal) and of patients diagnosed with DN were analysed with double immunofluorescence staining of CXCL16 (red fluorescence) and ADAM10 (green fluorescence) in glomeruli (upper panel) and tubules (lower panel). (B) Semi-quantitative analysis of fluorescence intensities of glomerular CXCL16 (grey bars) and glomerular and ADAM10 (black bars) expression is depicted in a graph. (C) oxLDL expression in renal sections of normal kidney (normal) and patients diagnosed with DN. Tissue sections were stained with oxLDL antibody followed by Cy3 coupled secondary antibody (red). (D) Immunofluorescence results of oxLDL expression in renal tissue of normal kidney and of patients with DN. Data represent mean ± S.D. ***P < 0.001, **P < 0.01 considered statistically significant compared to the normal kidney. (E) Double immunofluorescense analysis of oxLDL (red colour) and CXCL16 (green colour) was performed on kidney biopsies of patients with DN. Tissue section was stained with DAPI to visualize the nuclei of the cells.