
Figure 3.
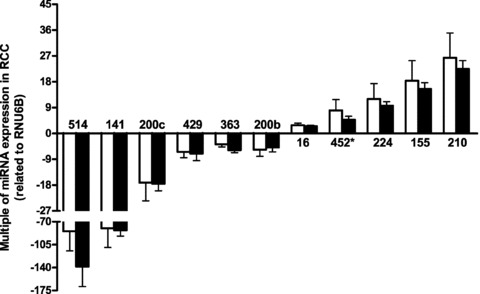
Multiples of microRNA expression ratios in clear cell renal cell carcinoma tissue samples compared with matched non-malignant samples measured in two sample sets. The gene expressions were normalized to RNU6B expression. Data are given as means ± S.E.M. The left blank columns represent the multiples of microRNA expressions in RCC samples of set 1 and the right-filled columns represent the multiples of microRNA expressions in RCC samples of set 2. No significant differences were observed between all microRNAs of set 1 and set 2 (P= 0.230–0.977; Mann–Whitney test), but all microRNAs were significantly different between malignant and non-malignant samples (P < 0.0001; Wilcoxon test).