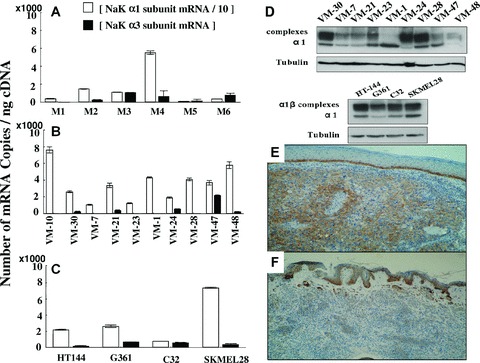
Figure 1.

Expression of α1 sub-units in human melanoma and naevi samples. (A–C) Analysis of the mRNA expression of sodium pump α sub-units by quantitative RT-PCR in 6 human melanoma metastases samples (A), 10 human melanoma primary cell cultures (B) and 4 ATCC human melanoma cell lines (C). The histopathological origin of each cell line is given in Table 2. White columns represent the number of mRNA copies of α1 sub-units divided by 10 in order to represent the results for α3 sub-units on the same plot. α2 sub-units were not expressed in these samples. Data are expressed as mean ± S.E.M. (D) α1 protein expression in vitro in investigated melanoma models analyzed by Western blot. Tubulin blots were used to assess equal protein loading. The primary cell culture VM-10 expresses comparable α1 amounts to VM-24 cells (data not shown). (E) Typical staining in brown of α1 sub-units in a human nodular melanoma specimen (G×40). (F) Typical staining in brown of α1 sub-units in a human dermal naevus (G×40).
