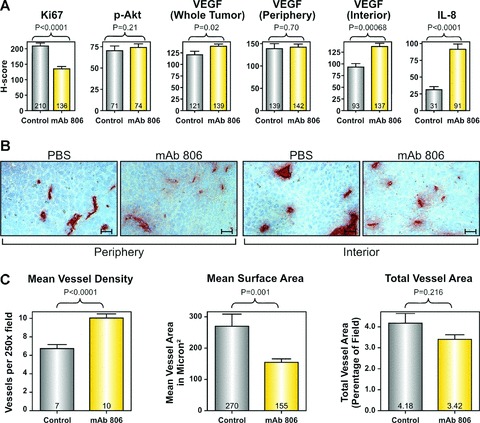
Figure 1.

Effect of mAb 806 treatment on tumour angiogenesis (a) Bar graphs showing the mean change in H-score between mAb 806-treated and control tumours for the biological parameters shown. (b) Representative (250×) images of CD31+ blood vessels in the mAb 806-treated or control tumours, stratified by intratumoral position. scale bar: 25 μM. (c) Bar graphs showing the mean change in the MVD, MSA and total vessel area in the mAb 806-treated or control tumours.
