Figure 3.


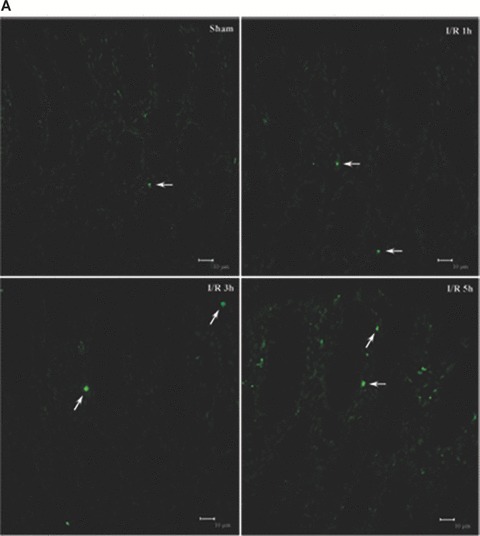
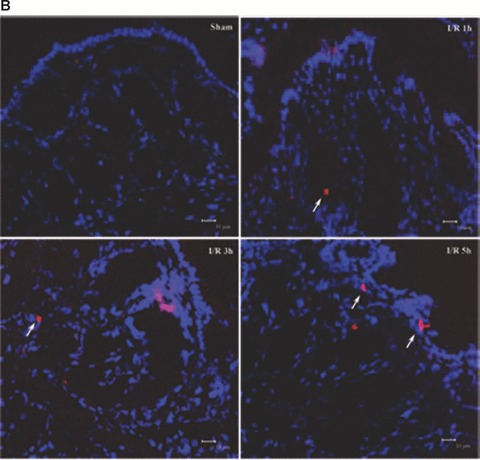
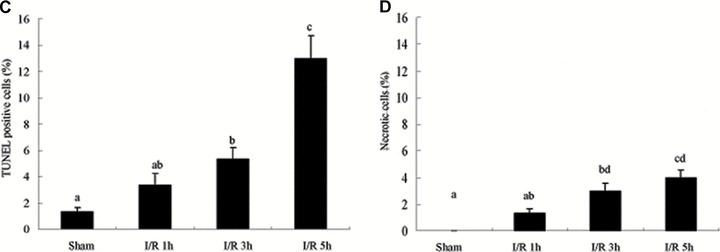
Analysis of apoptosis and necrosis in colons of I/R injury rats. (A) Representative TUNEL stains in colon tissues obtained from sham-operated and I/R rats. Apoptotic cells were shown as bright green fluorescence staining. (B) Detection of necrosis with PI staining. The DAPI (blue) and PI (red) fluorescence were shown. Quantitative analysis of TUNEL+ cells (C) and necrotic cells (D) in the colon at various time-points of reperfusion after 1 hrs ischaemia. White arrows depict TUNEL+ cells (A) and necrotic cells (B). Bars = 10 μm.
