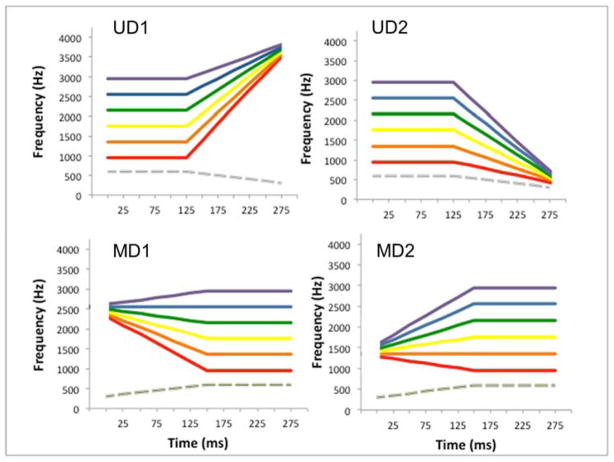
Figure 1.
Schematic spectrograms show the artificial nonspeech auditory category exemplars across time and frequency, for each uni-dimensional (UD1/UD2) and multidimensional (MD1/MD2) category. The dashed grey lines show the lower-frequency spectral peak that is common to all exemplars of a given category. Each colored line shows the higher-frequency spectral peak corresponding to a single category exemplar. See text for further details.

