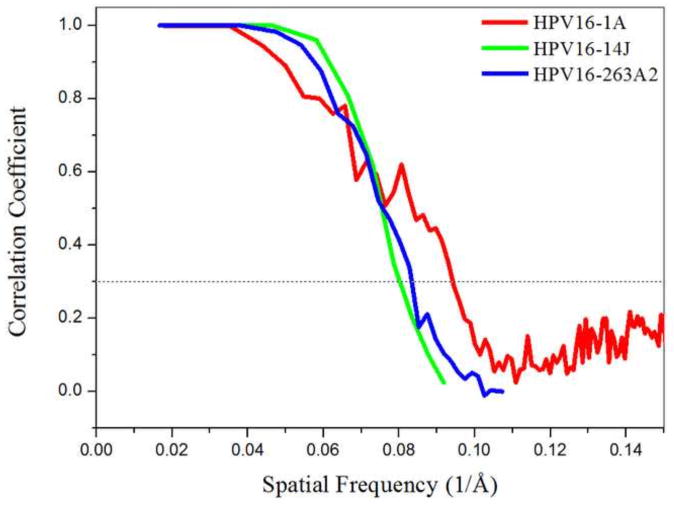
FIGURE 2. Plot showing Fourier shell correlation (FSC) versus spatial frequency of the icosahedrally averaged reconstructions for each of the virus-Fab complexes.
The resolutions of the reconstructions (10.6 Å for HPV16-1A, 12.0 Å for HPV16-14J, and 12.1 for HPV16-263.A2) were assessed where the FSC curve crossed a correlation value of 0.3. Due to different pixel sizes in the reconstructions, the FSC curves ended at different frequency values.

