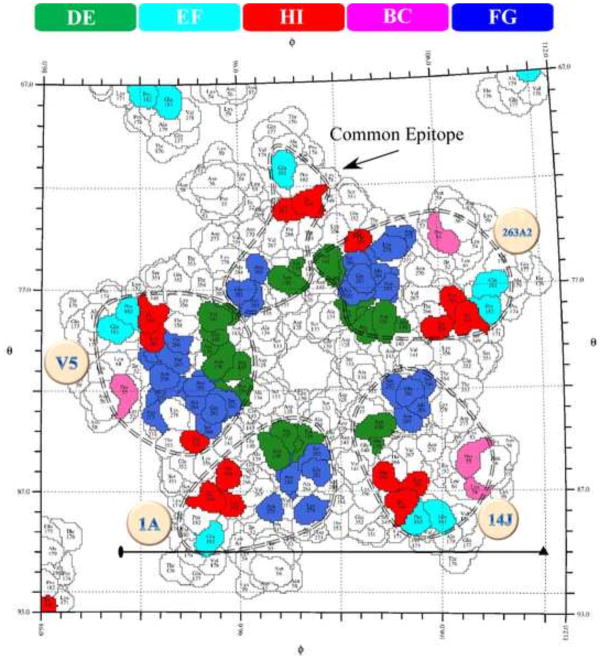
FIGURE 7. The roadmap shows the footprint of each antibody mapped to the stereographic projection of a capsomer.
The virus surface was represented as a quilt of amino acids, shown as a projection, for the icosahedral asymmetric unit, with the polar angles φ and θ representing the latitude and longitude (58). As in figure 6, the color bar identifies the contribution of the different antigenic L1 loops to each mAb epitope (dashed circle). The common epitope (arrow) includes all residues identified in each mAb footprint.

