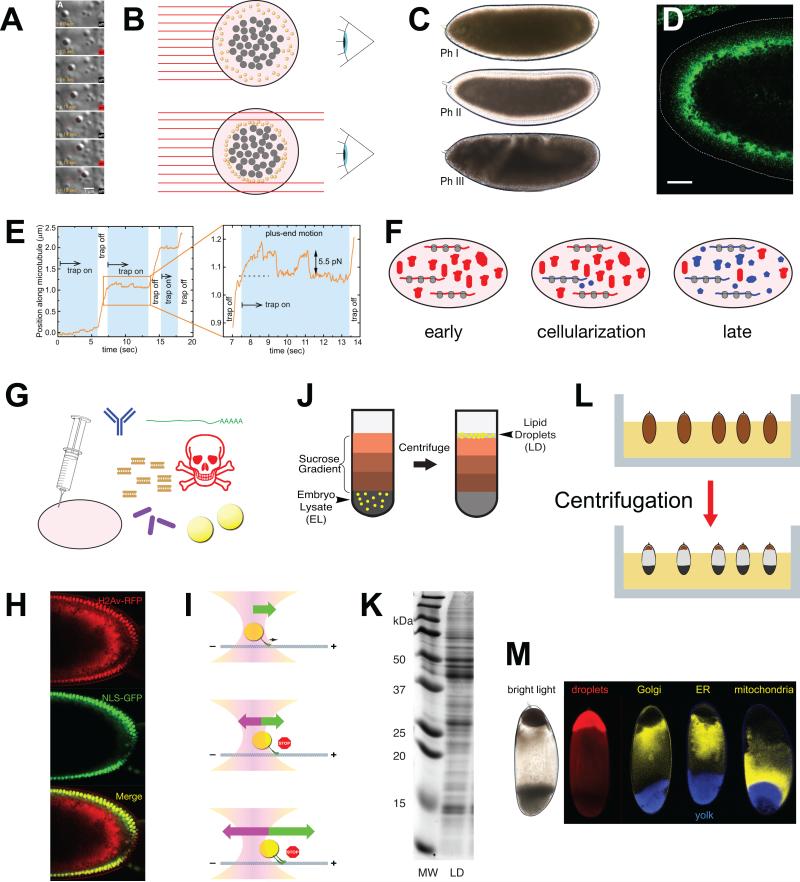
Figure 3. Methods to study Drosophila embryonic droplets.
(A) Lipid-droplet motion visualized by differential interference contrast (DIC) microscopy and manipulated by an optical tweezer/trap. Time in seconds is indicated as well as whether the laser (centered on the droplet) is turned on or off. Red line shows the position of the center of the lipid droplet tracked over time. The droplet proceeded steadily along a linear path (inferred to be a microtubule) and its progress was impeded by the optical trap. For details of the tracking and laser trap analysis, see E. (Image from [59]). (B) How lipid droplet distribution affects embryo transparency. Shown is an embryo cross-section perpendicular to the long axis of the embryo. Light (red lines) from a source on the left passes through the embryo and is collected by an observer on the right. Yolk granules (gray) and lipid droplets (yellow) scatter light and thus prevent light from passing through the cytoplasm. In the top embryo, lipid droplets are spread out all over the periphery and block light evenly. In the bottom embryo, lipid droplets have moved away from the periphery and are accumulated around the central yolk; hence, light can pass through the periphery. (C) Changes in lipid-droplet distribution cause altered embryo transparency. In Phase I and III, the embryo periphery is opaque because the abundant lipid droplets scatter light. In Phase II, the periphery is transparent because it is depleted of lipid droplets. Image from [76]. (D) Jabba immunostaining (green) to highlight lipid droplets. The dotted line outlines the embryo surface. In this Phase II embryo, the droplets have accumulated basally, clustering around the central yolk. Scale bar = 25 μm. Image modified from [16]. (E) Movement of a lipid droplet along a microtubule as a function of time, in the presence or absence of an opposing force from an optical trap. This image is from [59] and represents the quantitation of the experiments shown in (A). The enlarged portion shows that the droplet stalls when the trap is switched on and then drops to the trap center. Another movement attempt again results in a stall. When the trap is switched off, the motors are able to continue to move the droplet. The distance at which the stall occurred is a measure for the force generated by the motor(s) moving the droplet, in this case ~5.5 pN. (F) Early embryos contain proteins directly inherited from the mother (red blobs) as well as proteins generated in the embryo from translation of maternal messaged (red). By cellularization, the zygote has started transcribing its own genes, generating its own messages and proteins (shown in blue). Later in embryogenesis, translation is driven by zygotic messages and most, but not all, proteins are the product of zygotic transcription. (G) By microinjection, various substances can be introduced into embryos, including antibodies, mRNAs, dsRNAs for RNA interference, inhibitors, bacteria, and lipid droplets. (H) Transplantation of H2Av-RFP covered lipid droplets into recipient embryos in which nuclei are marked by NLS-GFP. Merged image reveals the transplanted lipid droplets in red; some of the droplet-bound H2Av-RFP was released from droplets and was transferred into nuclei. Image from [15]. (I) Principles of optical trapping. Top: Lipid droplet in the center of an optical trap (optical tweezer). It is propelled along the microtubule by the force generated by the microtubule motor. The trap does not yet exert any force on the droplet. Middle: Once the droplet is displaced from the laser center, the trap exerts a force pulling the droplet back towards the center. At some point, the force from laser and motor are balanced, resulting in stalled motion. Bottom: If the droplet is pulled by multiple motors, this force balance occurs at a distance further from the center of the laser. (J) Schematic representation of lipid-droplet purification by floatation. Embryo lysate in high-density buffer is overlaid by sucrose solutions of increasingly lower density. After centrifugation, lipid droplets can be recovered at the very top of the gradient. Image from [16]. (K) Protein content of lipid-droplet fraction after sucrose gradient. Proteins from droplet fraction (LD) were analyzed by SDS PAGE. MW = molecular weight markers. Image from [16]. (L) Schematic depiction of in-vivo centrifugation of embryos. Embryos before cellularization are embedded in agar to keep them in a fixed orientation (top). After centrifugation, the contents of each embryo are separated by density (bottom). Image from [127]. (M) Separation of organelles by in-vivo centrifugation. Living embryos were centrifuged as in (L), which results in distinct stratification visible by bright-field microscopy (left). Distribution of various organelles was detected by fluorescence microscopy. Image originally from [15], as modified in [127].

