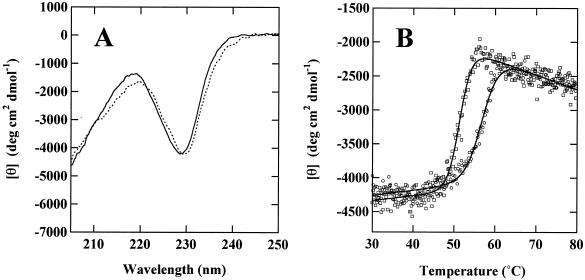
FIG. 4.
CD spectra and thermal-unfolding profiles of LepB and LepA. (A) Far-UV CD spectra of LepB (dotted line) and LepA (solid line) were measured at 20°C. (B) Thermal-unfolding profiles of LepB (squares) and LepA (circles) were monitored by changes in the CD intensity at 230 nm. The solid lines show a conventional two-state equation of the thermal-unfolding process.

