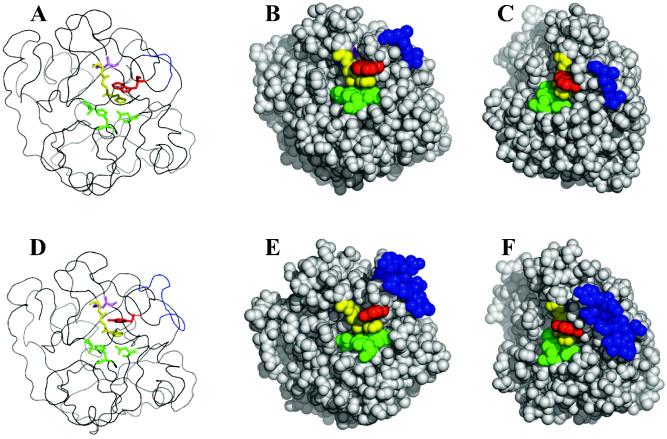
FIG. 8.
Modeling structure of LepB based on the tertiary structure of LepA. Shown are models for LepA (A to C) and LepB (D to F). The green and yellow residues represent catalytic triad and subsite residues, respectively. The red residues represent Trp169 (LepA) or Tyr169 (LepB). The pink residues represent Asp225 (LepA) or Asp232 (LepB). The blue residues represent the gap sequences (LepA, Gly172-Thr175; LepB, Ala172-Gly182).

