
Figure 2.
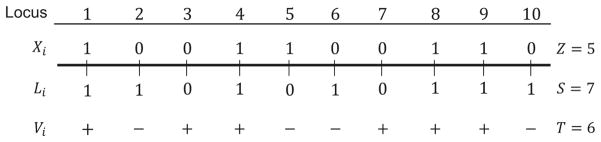
A schematic of one realization of our quantitative trait model with 10 loci. For a given trait, loci are labeled according to whether the “1” or the “0” allele is the “+” allele. These labels are the Xi, and their sum is Z. The Xi are independent Bernoulli random variables with probability 1/2, so Z is a binomial random variable. For every individual, we draw alleles at each locus according to the allele frequencies in the individual’s population—these are the Li, and their sum is S. The Li are independent Bernoulli random variables with probability p in population A and q in population B, so S is also binomial in each population. If Xi = Li, then the individual has a “+” allele at the ith locus (Vi = 1). The number of “+” alleles for an individual is the trait value, T.