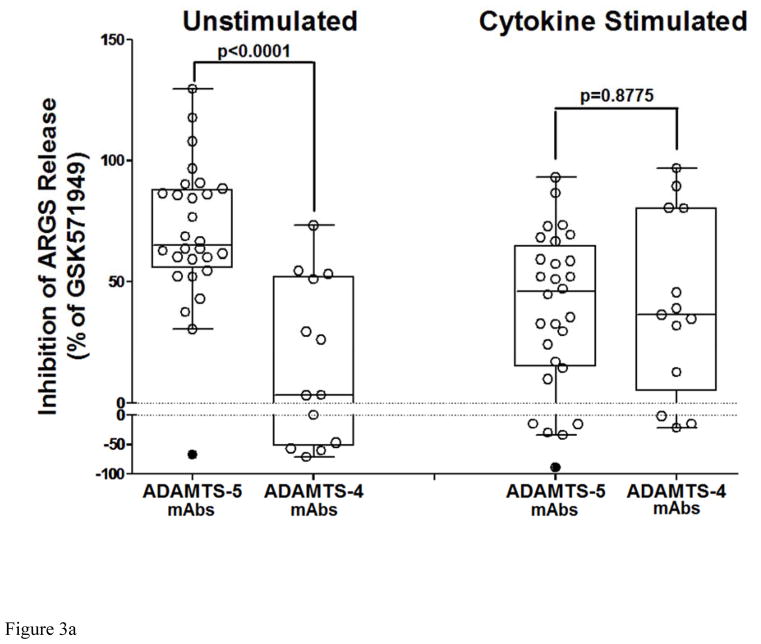
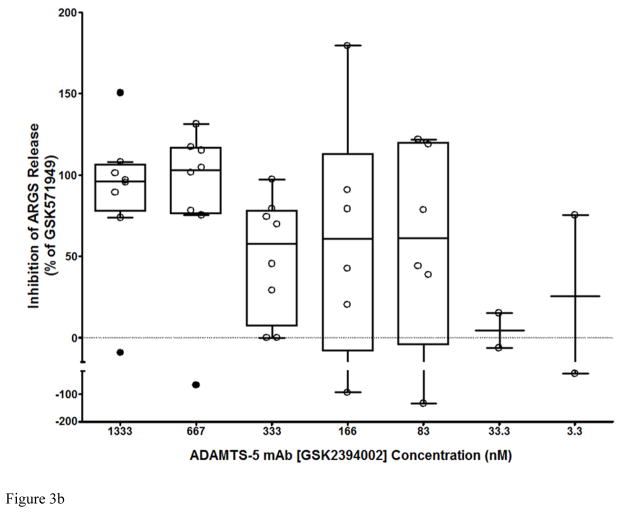
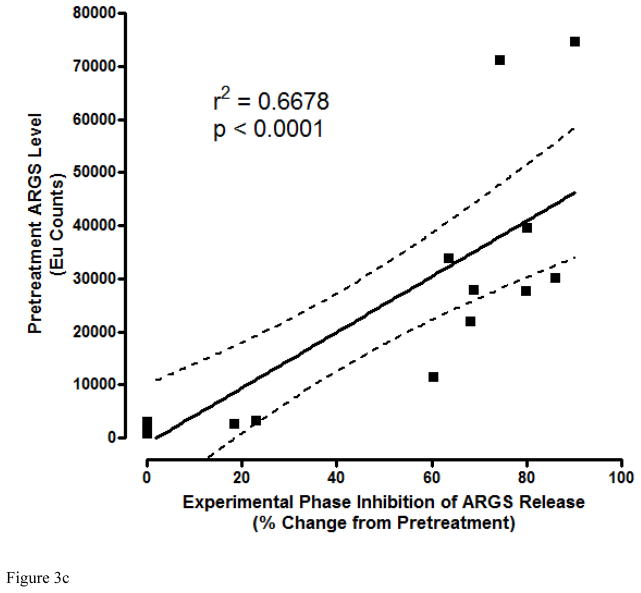
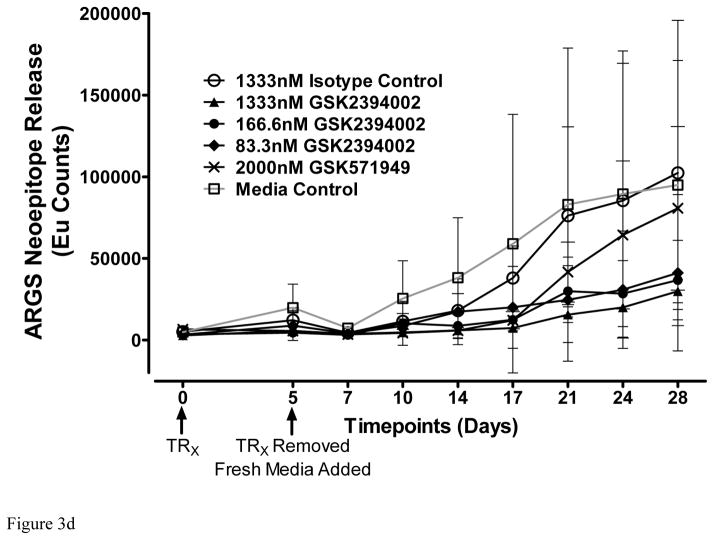
Figure 3.
Potent and sustained inhibition of aggrecanolysis from human OA cartilage explants by ADAMTS-5 mAb treatment. ADAMTS-5 mAb treatment inhibits ARGS neoepitope release from sequentially unstimulated and IL-1b/OSM stimulated human OA cartilage explants (a), whereas only modest inhibition is observed with ADAMTS-4 mAb treatment, preferentially under cytokine-stimulated conditions. Mean percent inhibition of mAbs is shown relative to isotype control mAb (0% inhibition, dashed lines in a and b) and GSK571949 (100% inhibition) treatment. Experiments were conducted with 7 replicates for each treatment condition from 8 timepoints across multiple 28-day experiments consisting of a 21 day unstimulated phase followed by a 7-day cytokine-stimulated phase. A total of 13–28 independent OA patient experiments were conducted for each treatment condition. ADAMTS-4 (7E8.1E3 or 7C71.H1) and ADAMTS-5 (12F4.1H7 or 7B4.1E11) mAb treatments are shown as compiled data associated with each mAb specificity. All mAb treatments were held constant at 670nM throughout the experiment and GSK571949 was similarly held at 2 μM. (b) Dose-dependent inhibition of ARGS neoepitope release is evident with GSK2394002 treatment in the absence of exogenous cytokine stimulation using cartilage from individual OA donors with elevated pretreatment ARGS neoepitope levels (n=2–8 independent donor experiments per treatment concentration and each point represents mean % inhibition from 21 day unstimulated phase, as described in (a)). Plots (a and b) are presented in standard box-and-whisker format with Tukey outliers noted (>1.5 times IQR, filled symbols). (c) Linear regression analysis suggests the response to GSK2394002 treatment correlates with pre-treatment ARGS neoepitope levels. Sustained suppression of ARGS neoepitope release is observed with pulse-chase GSK2394002 treatment in relation to small molecule (GSK571949) in individual donor experiments using cultures with elevated pretreatment ARGS neoepitope levels (n=4; each timepoint and ±95% CI error bar represents mean of 4 independent donor experiments where 7 biological replicates for each donor/timepoint was used to calculate a within donor mean for each timepoint) (d).


