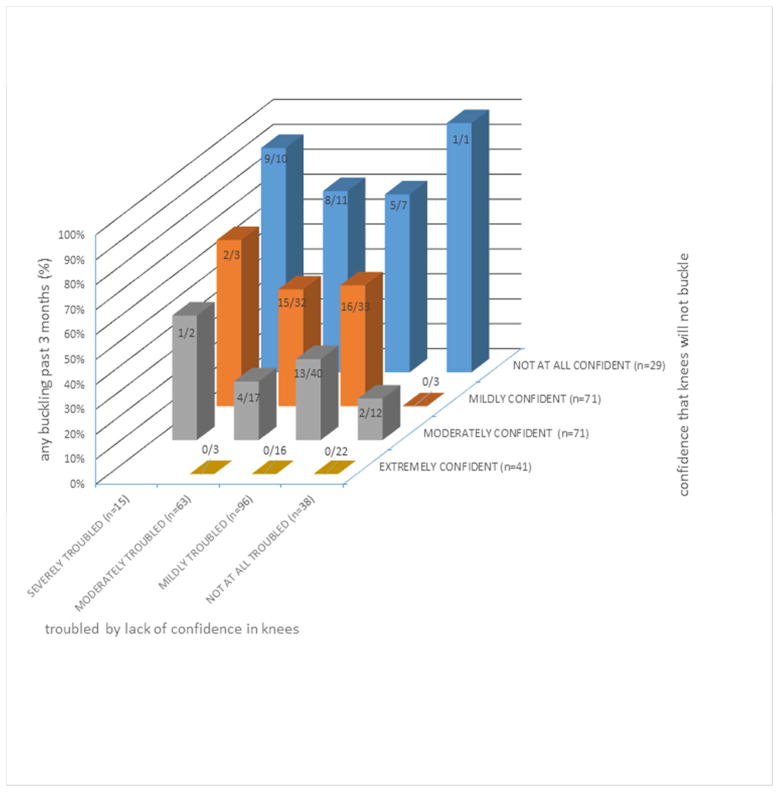
Figure 2. Percentage of Persons with Buckling within Groups Defined by Both Confidence Variables.
The height of each bar in the figure corresponds to the percentage of persons who had buckling within groups defined by the values of both confidence variables shown on the axes. The fractions at the top of each bar show the actual number with buckling divided by the number who had the specified value for each of the confidence variables.

