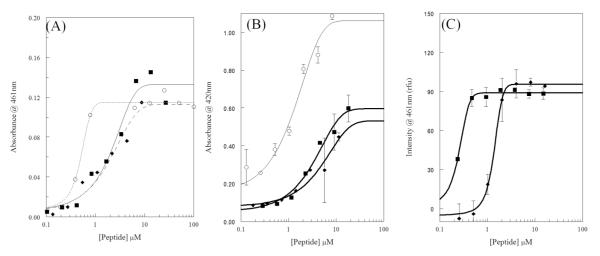
Figure 2.

Bacterial membrane permeabilization. For all graphs melittin is shown as squares (■), AzAla-Melittin as diamonds (◆), and control compounds as open circles (○). (A) Permeabilization of E.coli outer membrane (OM) assayed by enzymatic breakdown of nitrocefin. Control is polymyxinB. Curve scheme is: solid – melittin, dashes – AzAla Melittin, dots – polymyxinB. (B) Permeabilization of E.coli inner membrane (OM) assayed by enzymatic breakdown of ONPG. Control is CTAB. (C) Permeabilization of S.aureus membrane assayed by binding of DAPI to bacterial DNA. All data were fit to a dose-response functions and are averages of at least 3 replicates. Error bars are omitted for graphical clarity in (A).
