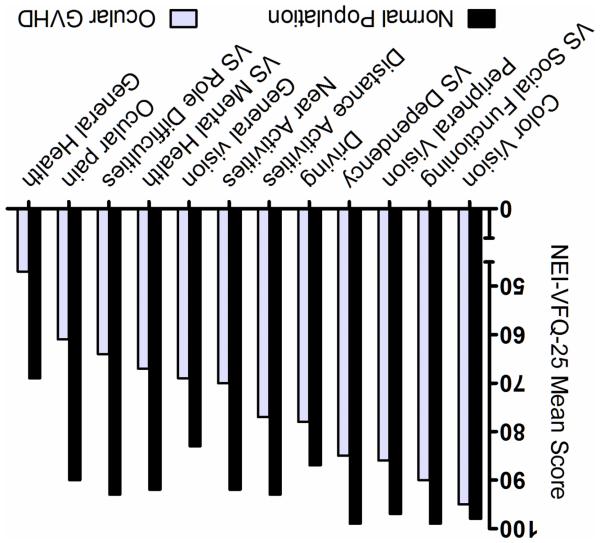
Figure 1.
Comparison of the mean National Eye Institute Visual Function Questionnaire-25 scores between ocular graft-versus-host disease patients (n = 84) and a healthy reference population from the article by Mangione et al.13 (n = 122). VS: vision-specific. P value was < 0.001 in all the subscales except for the color vision subscale (P = 0.11).

