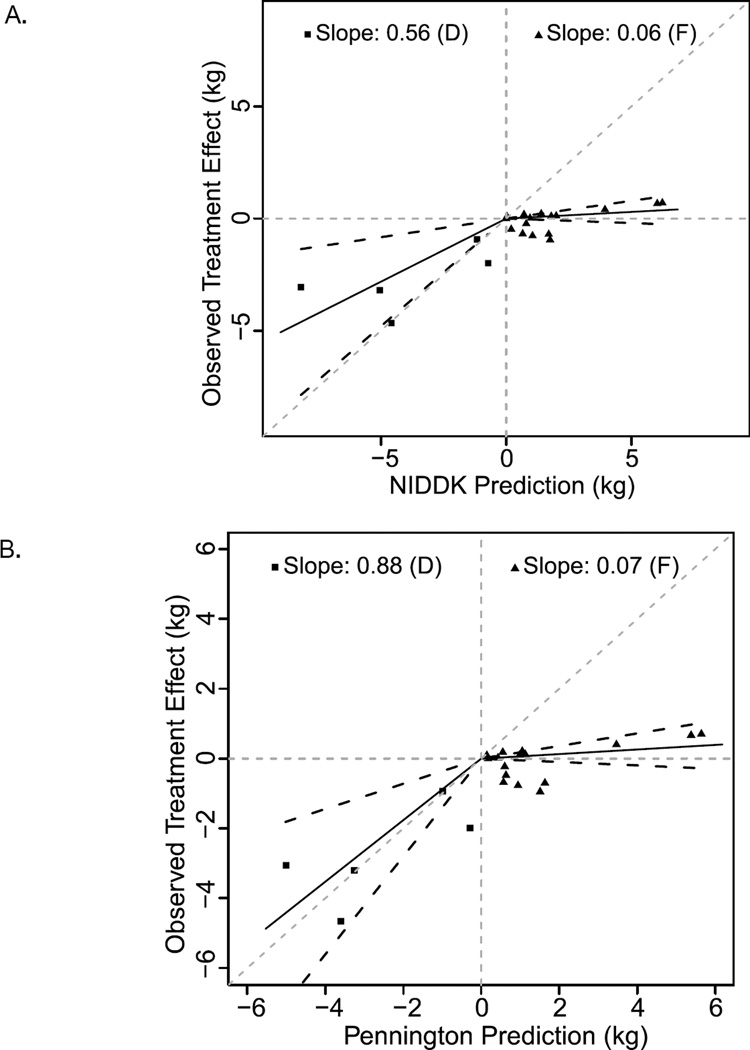
Figure 2.
NIDDK and Pennington calculator predictions for caloric restriction (D, squares) and overfeeding (F, triangles) interventions. NIDDK (A) and Pennington (B) model predictions (x-axis) versus actual observed weight changes for all studies (y-axis) Each individual point represents a control vs. treatment comparison; the solid lines are lines of best fit for slope and black dashed lines are 95% confidence intervals. Gray dashed lines are axes and lines of identity. Overall, predictions are an overestimate of observed weight change.

