
Figure 1.
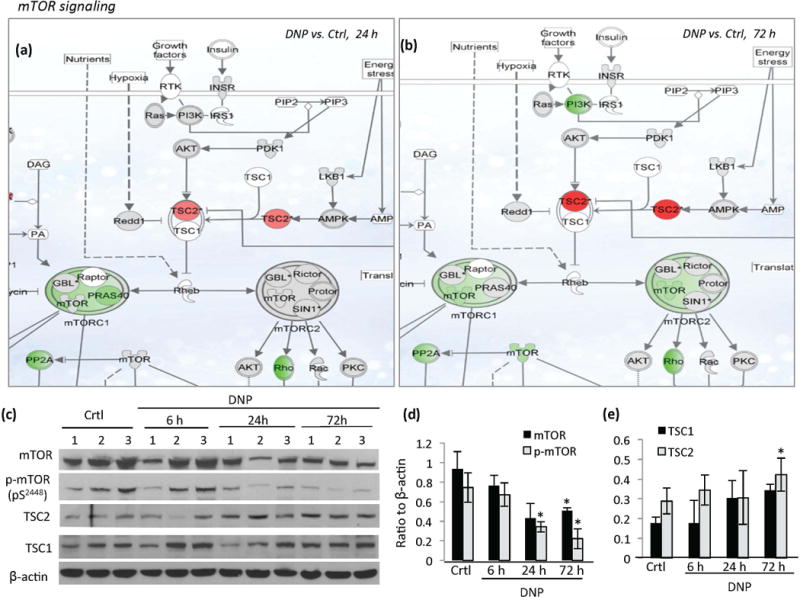
Evidence that mild mitochondrial uncoupling modulates mTOR signaling in the cerebral cortex. (a and b) Schematic diagrams depicting the effects of DNP on the expression of genes in the mTOR signaling pathway showing genes upregulated (red) and downregulated (green) in the cerebral cortex at 24 hours (a) or 72 hours (b) following DNP treatment compared to vehicle-treated control mice. Grey denotes no significant change and white denotes data not available. Genes with a z-score above 1.5 compared to vehicle-treated control were considered significantly changed. (c) Immunoblot analysis of the indicated proteins in cerebral cortex samples from DNP-treated and control mice (n= 7–10 mice/group; samples from 3 animals/group were presented). (d and e). Results of densitometric analysis of the indicated proteins (normalized to β-actin level). Values are mean ± SD. *p<0.05 two tailed compared to the values of DNP to vehicle-treated control mice.