
Figure 2.
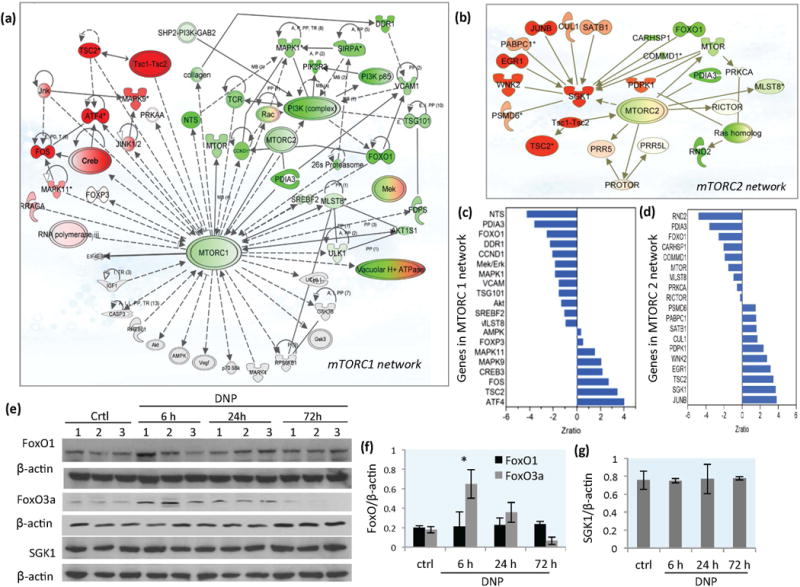
DNP treatment triggers mTORC1 and mTORC2 signaling network re-programming in the cerebral cortex. (a) Gene expression network profile showing genes in the mTORC1 signaling network that were upregulated (red) or downregulated (green) in the cerebral cortex of mice in response to DNP treatment (72 hours). (b) Gene expression profile showing upregulated (red) and downregulated (green) genes in the mTORC2 signaling network from cerebral cortex of mice in response to DNP treatment (72 hours). The attributes that appear both red and green are genes that encode proteins that form complexes; some genes that encode proteins in the complex are up-regulated (red) and some are down-regulated (green). (c) List of genes with z-ratio change in response to DNP treatment in mTORC1 signaling network at 72 hours. (d) List of genes with z-ratio change in response to DNP treatment in mTORC2 signaling network at 72 hours. (e) Immunoblot showing levels of FoxO1, FoxO3a, SGK1 and β-actin in cerebral cortex tissue samples from vehicle-treated control mice and mice that had been treated with DNP for the indicated time periods. (f and g) Densitometric quantification of protein band intensities normalized to β-actin. Values are mean ± SD.