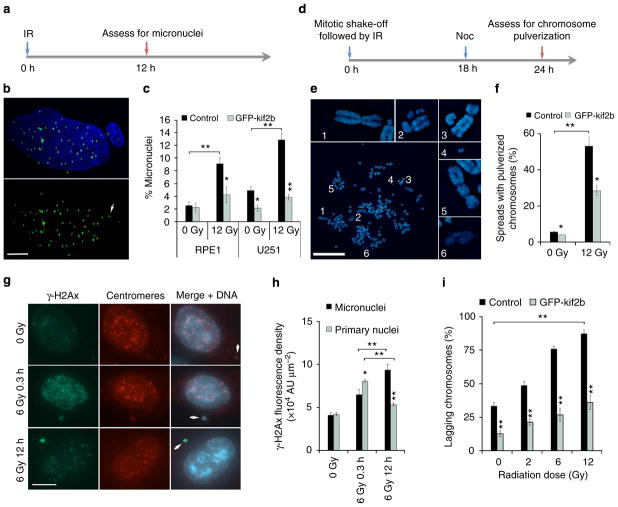
Figure 3. IR-induced chromosome segregation errors lead to widespread chromosomal damage.
(a) Experimental schema for assessing the generation of IR-induced micronuclei. (b) Example image of a U251 cell containing a micronucleus stained for centromeres (green) and DNA (blue), scale bar, 5 μm. (c) Percentage of RPE1 and U251 cells containing micronuclei as a function of IR dose. Bars represents mean±s.e.m., n = 266–824 cells, three experiments, *P<0.05, **P<0.001, two-tailed t-test. (d) Experimental schema for assessing the generation of IR-induced chromosome pulverization. (e) Representative mitotic spread containing pulverized chromosomes from U251 cells irradiated with 12 Gy 24 h prior. Scale bar, 20 μm, which show a normal appearing chromosome (1), chromosome fragments (2–4), a dicentric chromosome (5) and uncondensed chromatin (6). (f) Percentage of mitotic spreads from containing pulverized chromosomes from control and U251 cells expressing GFP-Kif2b. Bars represent mean±s.e.m.; n>450 mitotic spreads, three experiments, *P<0.05, **P<0.001, two-tailed t-test. (g) Examples of U251 cells, exposed to 0 Gy, 6 Gy and fixed either 0.3 or 12 h later, containing micronuclei that encompass whole chromosomes (arrows) as evidenced by centromere staining (red) that were also stained for γ-H2AX (green) and DNA (blue). Scale bar, 5 μm (h) γ-H2AX fluorescence intensity in primary nuclei and micronuclei in U251 cells exposed to 0 and 12 Gy stained 0.3 or 12 h after irradiation. AU, arbitrary units; bars represent mean±s.e.m.; n>30 cells, three experiments, *P<0.05, **P<0.001, two-tailed t-test. (i) Percentage of anaphase spindles containing lagging chromosomes as a function of IR dose, in control and GFP-Kif2b-overexpressing U251 cells. Bars represents mean±s.e.m., n = 150 cells, three experiments, **P<0.001, two-tailed t-test.

