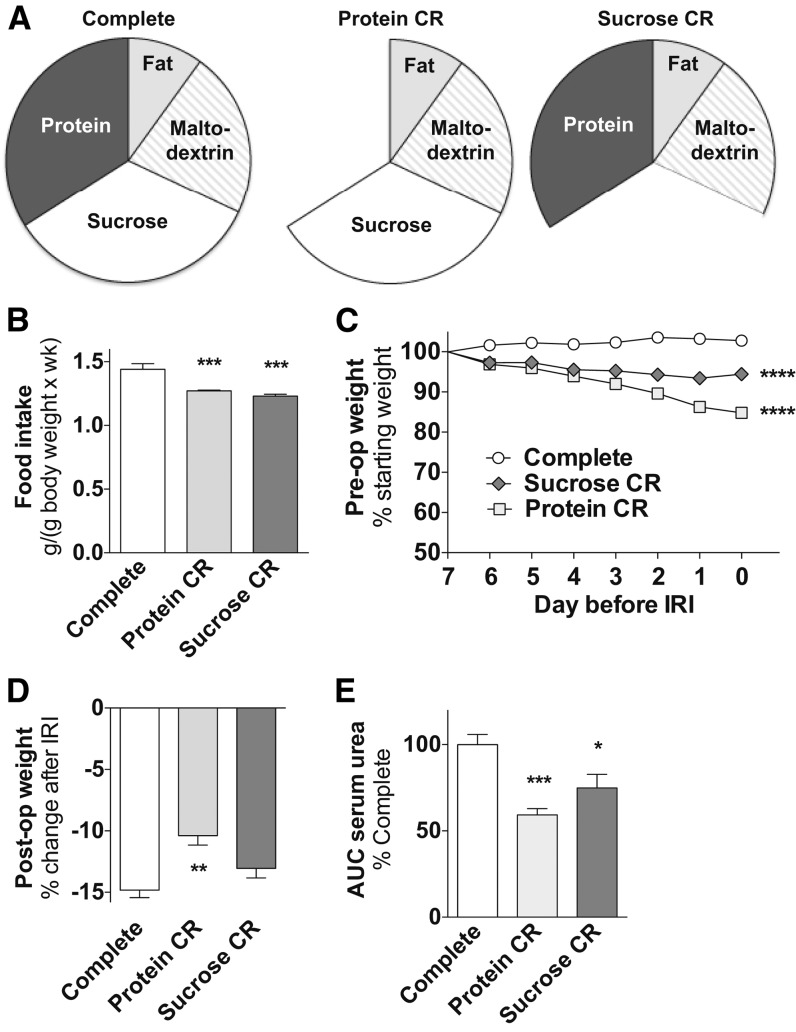
FIGURE 2.
Effects of 1 wk of protein vs. carbohydrate restriction against renal IRI in male mice in experiment 2. (A) Schematic of complete or restricted diets that lack calories specifically from protein (protein CR) or sucrose (sucrose CR) with pie slices proportional to the calorie content of the indicated macronutrient. (B) Total food intake during the preconditioning period of the indicated groups, n = 2–3 cages/group. (C) Mouse weights during the preconditioning period are expressed as percentage of starting weight. (D) Postoperative weight on day 3 after IRI is expressed as a percentage change after IRI. (E) Kidney function after renal IRI is expressed as a percentage of serum urea AUC of the complete group. Values are means ± SEMs; n = 8–14 mice/group. *,**,***,****Different from complete control diet group: *P < 0.05, **P < 0.01, ***P < 0.001, and ****P < 0.0001. CR, calorie restriction; IRI, ischemia reperfusion injury; post-op, postoperative; pre-op, preoperative.

