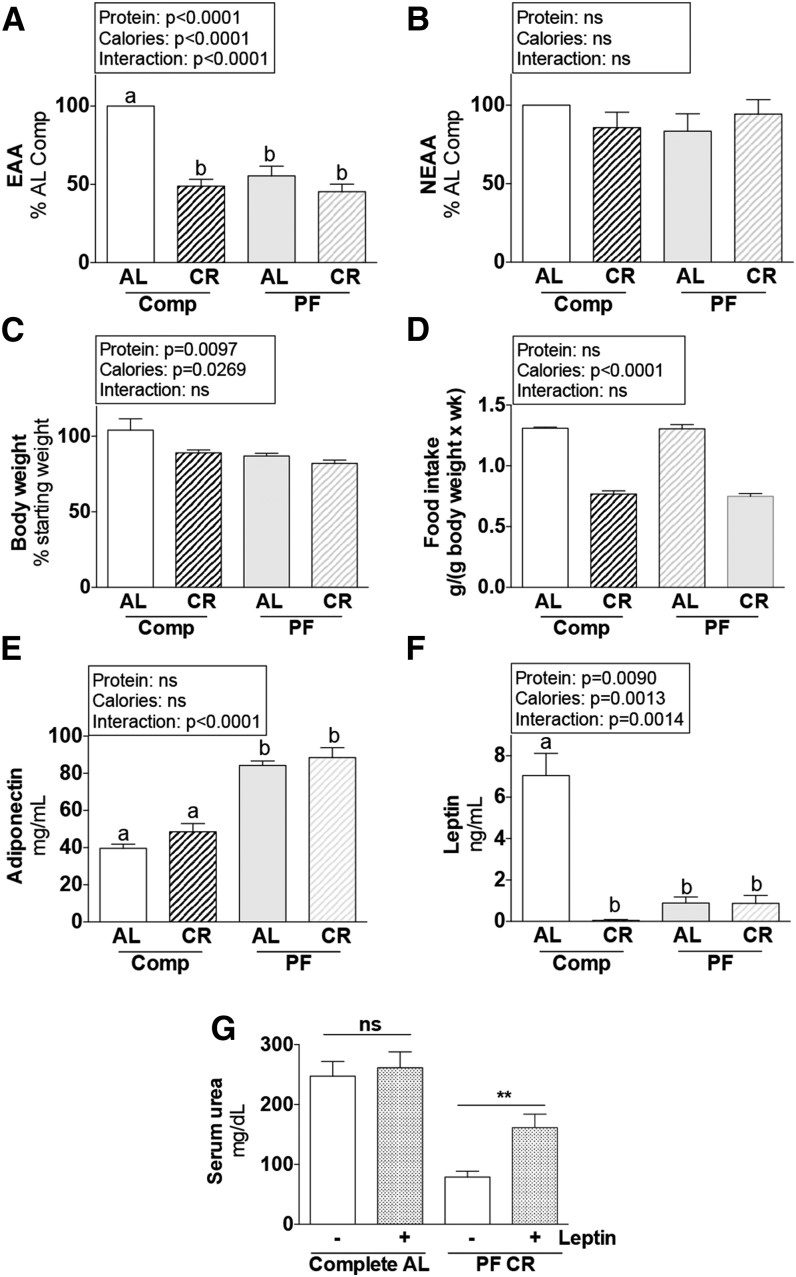
FIGURE 6.
Metabolic and serum variables of male mice after 1 wk of protein and/or CR in experiment 5. (A, B) Combined means of individual serum EAAs (A) and NEAAs (B) calculated as a percentage of the AL complete diet group, after 1 wk fed the indicated diet. (C) Body weight is expressed as a percentage of the starting value. (D) Total food intake during the preconditioning period of the indicated groups; n = 2 cages/group. (E, F) Serum concentrations of adiponectin (E) and leptin (F) after 1 wk fed the indicated diet. Main effects of dietary protein (protein = complete vs. PF), food restriction (calories = AL vs. CR), and interactions are indicated above each graph with P values; ns, P > 0.05. Means without a common letter differ, P < 0.05; n = 5 mice/group. (G) Serum urea on day 1 after renal IRI of mice preconditioned with the indicated diet 1 wk before surgery and treated with leptin or vehicle in experiment 7 as indicated. **Different from vehicle control within diet, P < 0.01; n = 10–15 mice/group. Values are means ± SEMs. AL, ad libitum; Comp, complete diet; CR, ∼50% calorie restriction; EAA, essential amino acids; IRI, ischemia reperfusion injury; KO, knockout; NEAA, nonessential amino acids; PF, protein-free diet; WT, wild-type.

