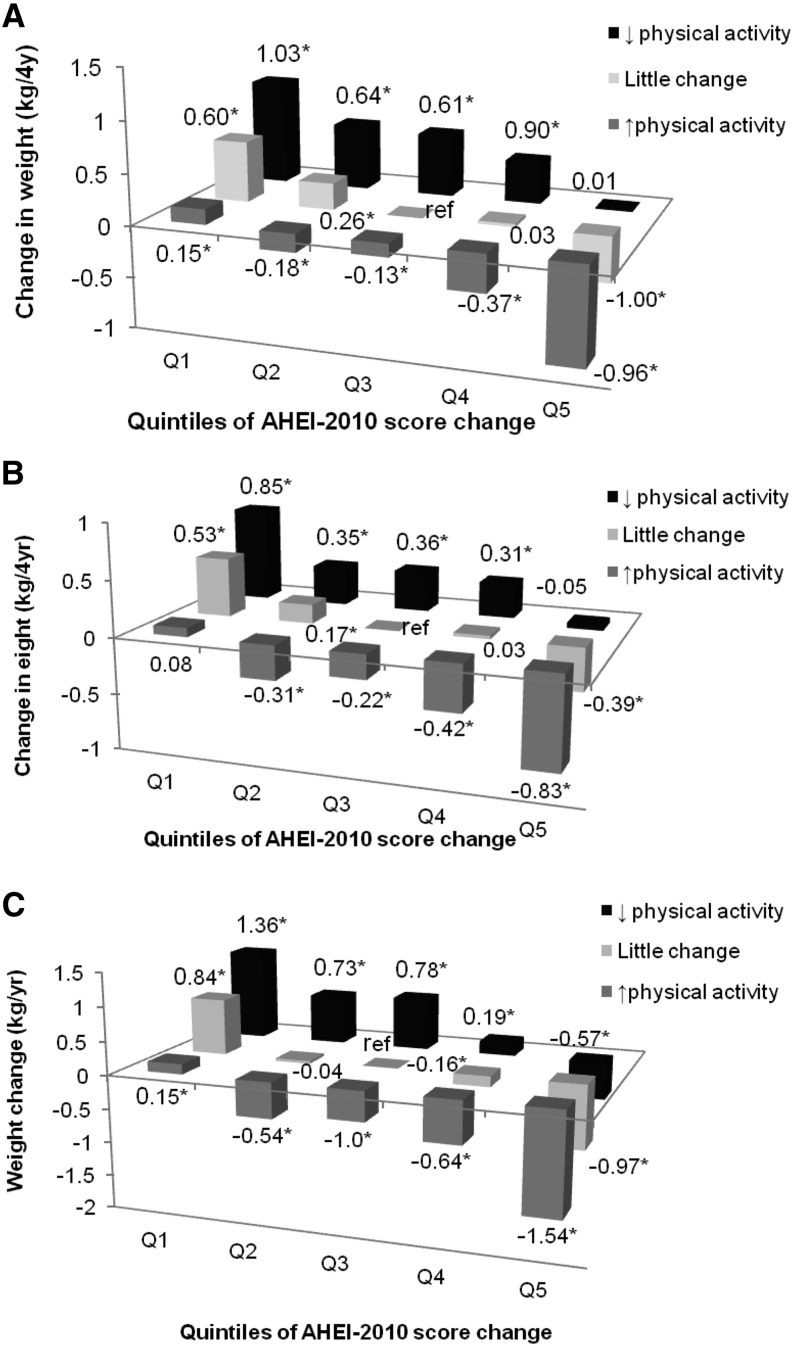
FIGURE 1.
Multivariable-adjusted joint classification of change in AHEI-2010 score and change in physical activity and 4-y weight change (in kg) in the NHS (n = 50,603; A), HPFS (n = 22,973; B), and NHS II (n = 72,495; C) cohorts. *P < 0.05. Adjusted for age, baseline BMI, smoking, baseline and change in physical activity, hours of sleep, hours of sitting, alcohol (DASH score only), and, for women only, parity, menopausal status, and postmenopausal hormone use. AHEI-2010, Alternate Healthy Eating Index 2010; HPFS, Health Professionals’ Follow-Up Study; NHS, Nurses’ Health Study; NHS II, Nurses’ Health Study II.

