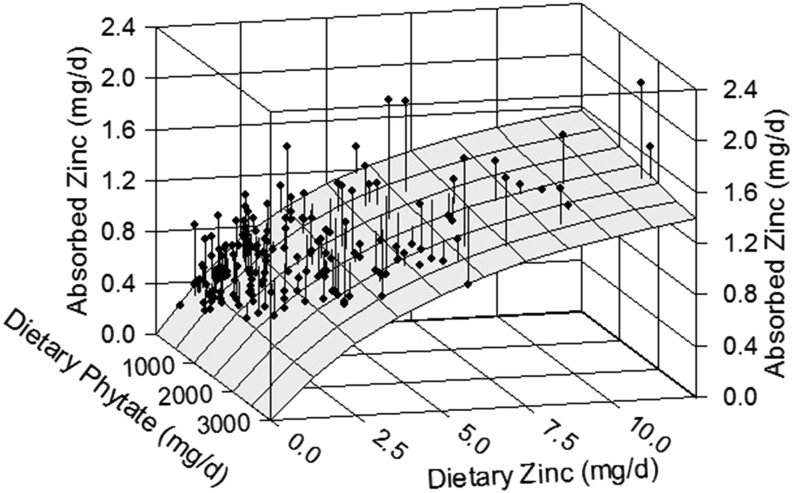
FIGURE 1.
The relation of daily absorbed zinc to dietary zinc and phytate intake in infants and young children. The surface represents the absorption response predicted by the Equation 1 model fitted to the infant/child data having TDPA values (n = 172). The vertical lines from each datum to the surface show the residual, i.e., the deviation of the point from the model’s prediction. Although an increase in absorption with increasing zinc intake is evident, there is only the suggestion of an inhibiting effect of phytate in the small downward slope of the surface with increasing phytate intake (most evident at the right side). TDPA, total daily dietary phytate (phytic acid).

